Fig. 2
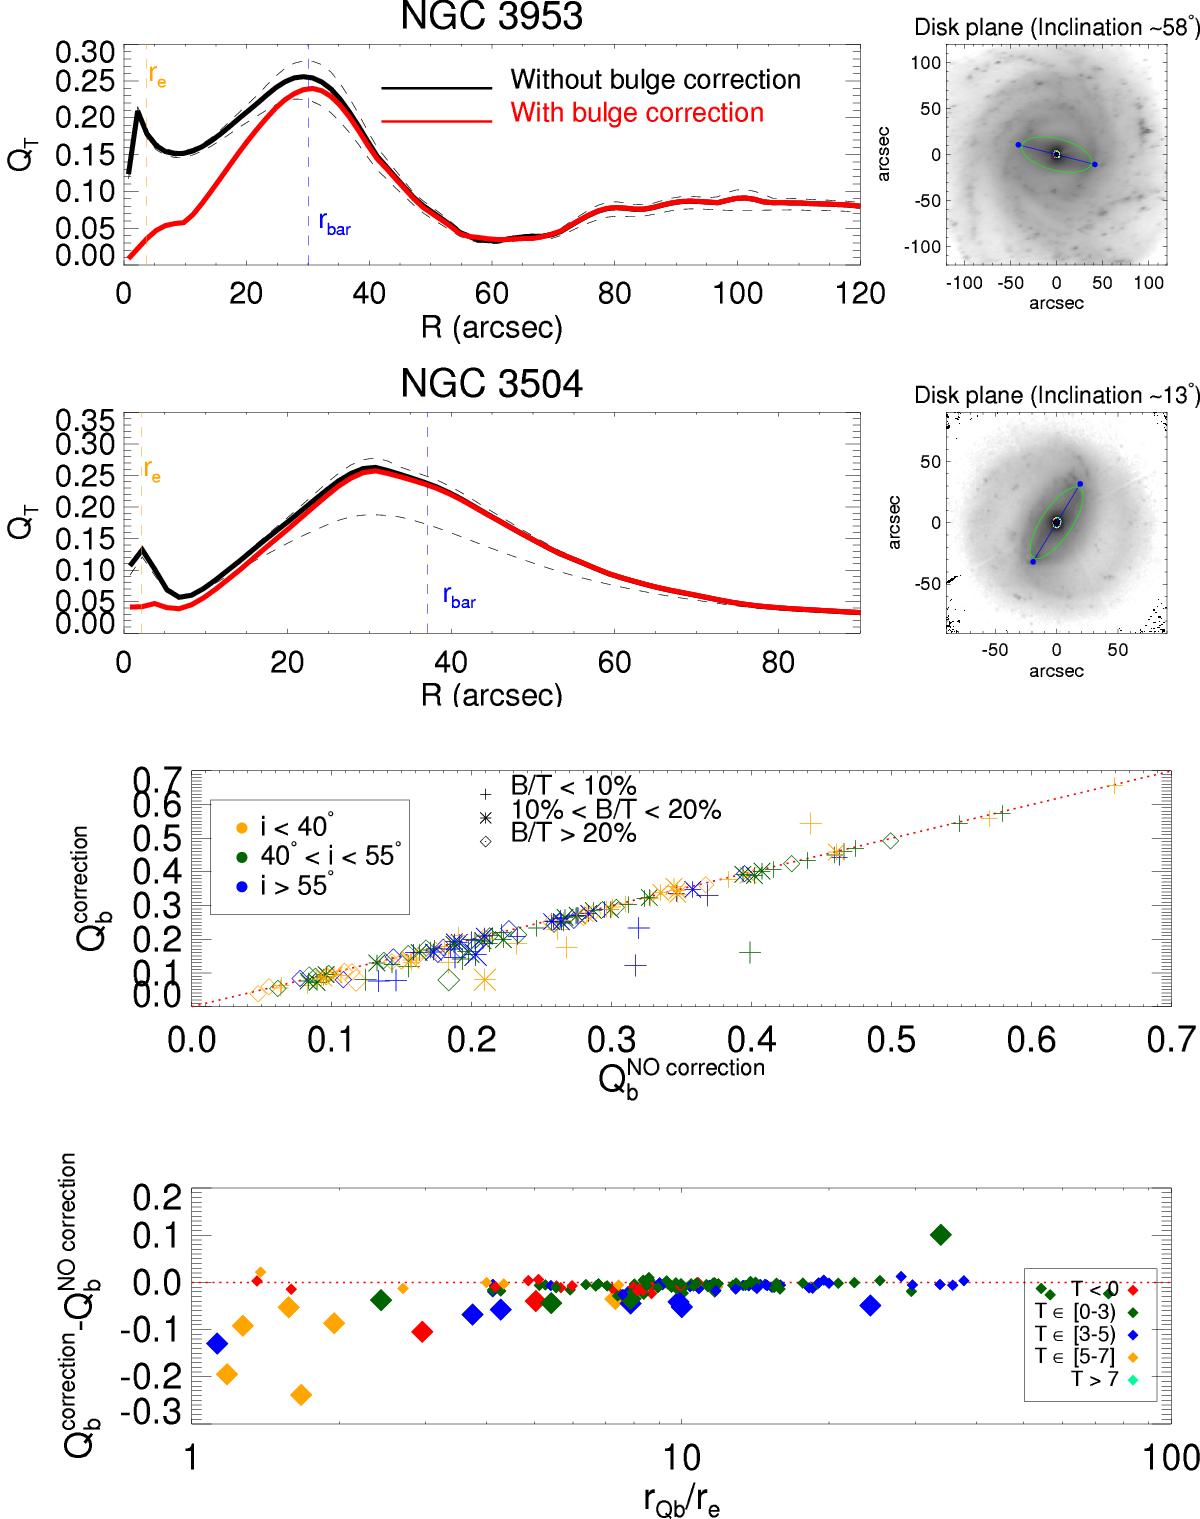
First and second rows: radial force profile of NGC 3953 and NGC 3504 with and without spherical bulge correction. The former (red line) represents the QT profile when the bulge flux is subtracted from the image before de-projection of the image to face-on orientation and added back afterwards for the potential calculation. For the first galaxy, the global maximum of QT, which corresponds to Qb, is slightly overestimated if no correction is considered, but remains within the limits determined by the disk thickness uncertainty (black dashed lines). The visual estimate of the bar length and the effective radius of the bulge are indicated with vertical dashed lines. Third and fourth rows: comparison of Qb measurements with and without bulge stretching correction for the galaxies with bulge in P4, with the data binned based on the disk inclination and the bulge-to-total ratio (P4). The strength of the correction is also studied in terms of the location of rQb with respect to the effective radius of the bulge from P4 (re), separating the galaxies according to their morphological class. The outliers in the third row are also indicated with larger symbols in row 4.

Current usage metrics show cumulative count of Article Views (full-text article views including HTML views, PDF and ePub downloads, according to the available data) and Abstracts Views on Vision4Press platform.
Data correspond to usage on the plateform after 2015. The current usage metrics is available 48-96 hours after online publication and is updated daily on week days.
Initial download of the metrics may take a while.