Fig. 20
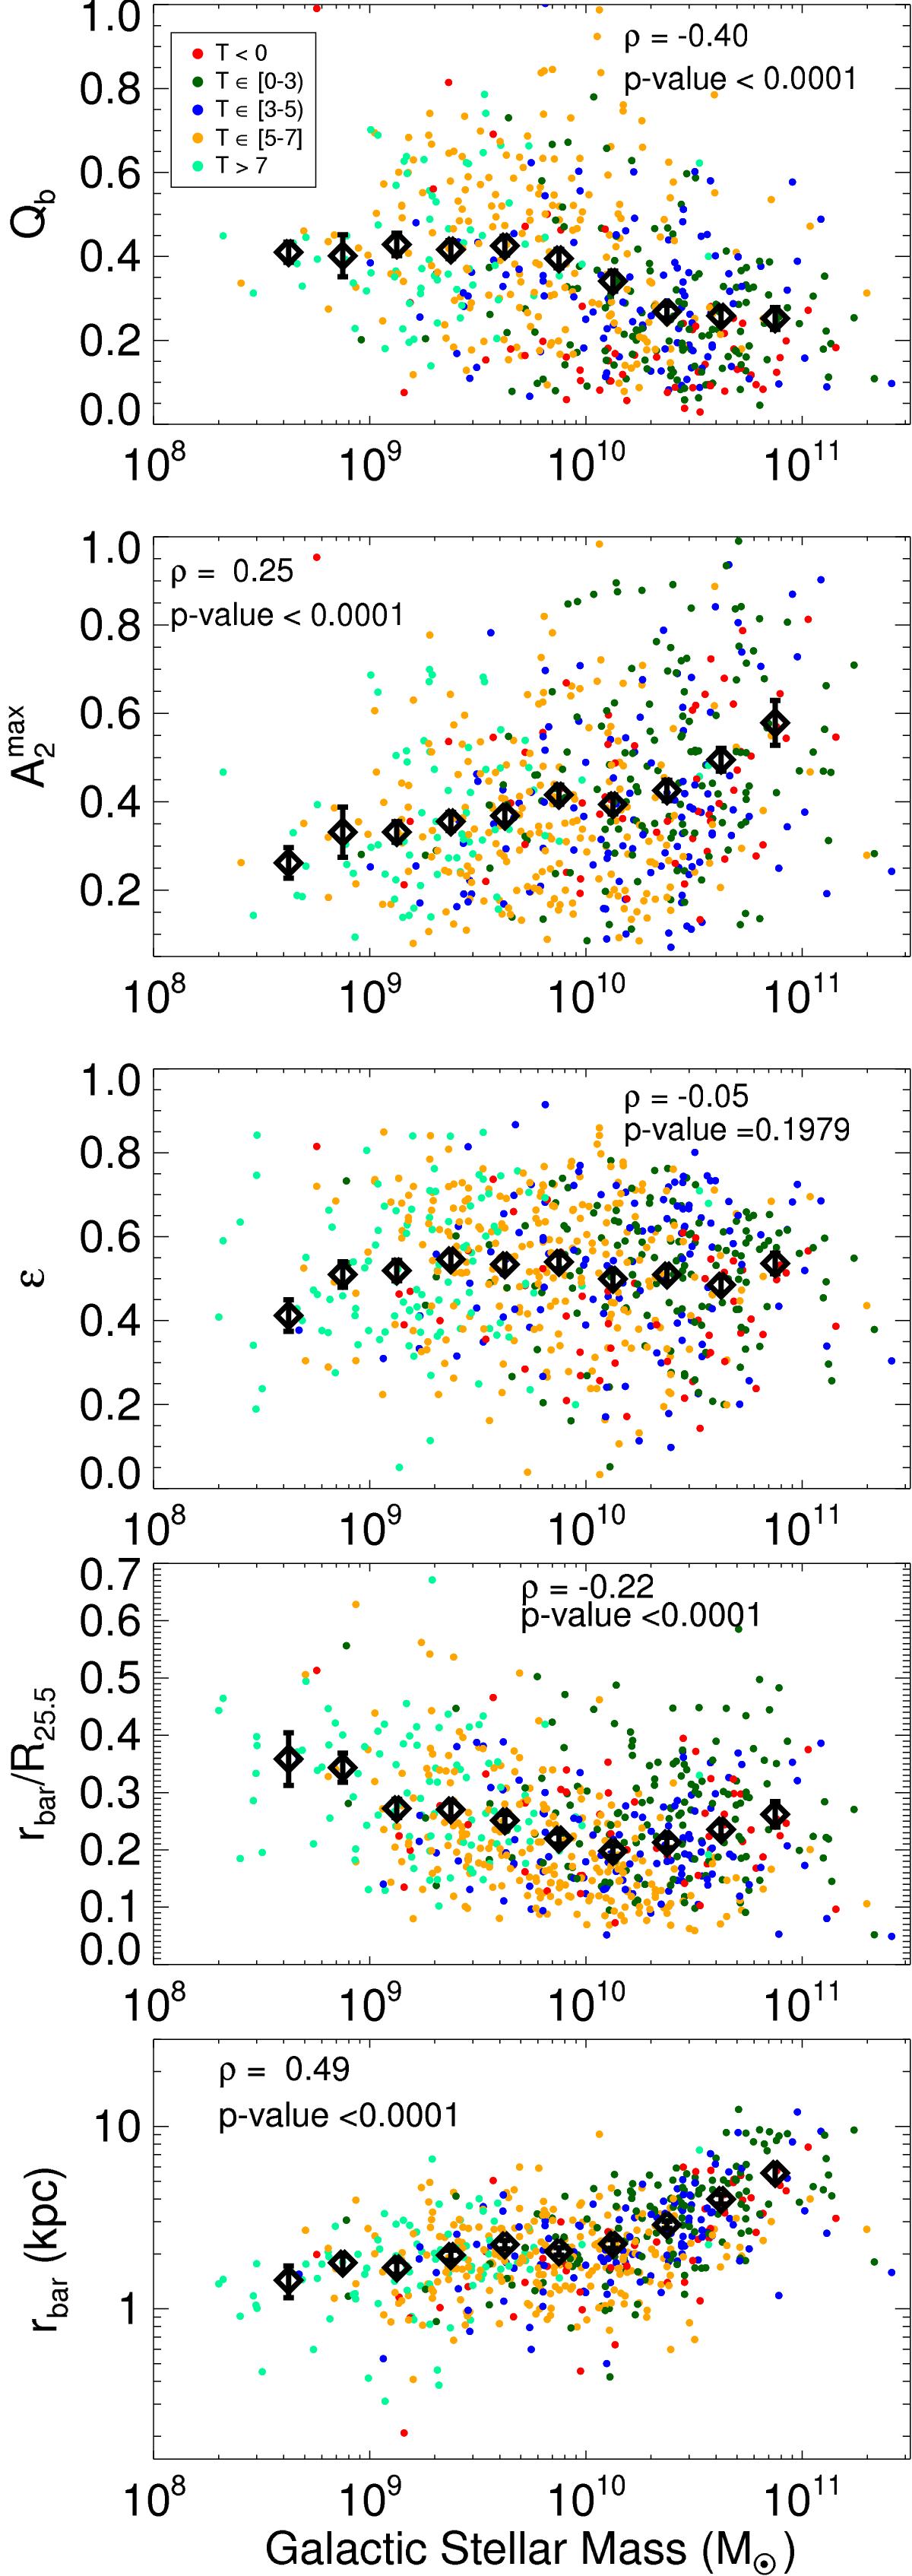
Gravitational torque, bar density amplitude, bar intrinsic ellipticity, and R25.5-relative and absolute bar size (in physical units) vs. stellar mass. Spearman’s rank correlation coefficient and significance are displayed in the plots. Different morphological types are separated following the colour palette shown in the legend of the first panel. The black symbols correspond to the running mean, and the error bars correspond to the standard deviation of the mean.
Current usage metrics show cumulative count of Article Views (full-text article views including HTML views, PDF and ePub downloads, according to the available data) and Abstracts Views on Vision4Press platform.
Data correspond to usage on the plateform after 2015. The current usage metrics is available 48-96 hours after online publication and is updated daily on week days.
Initial download of the metrics may take a while.