Fig. 21
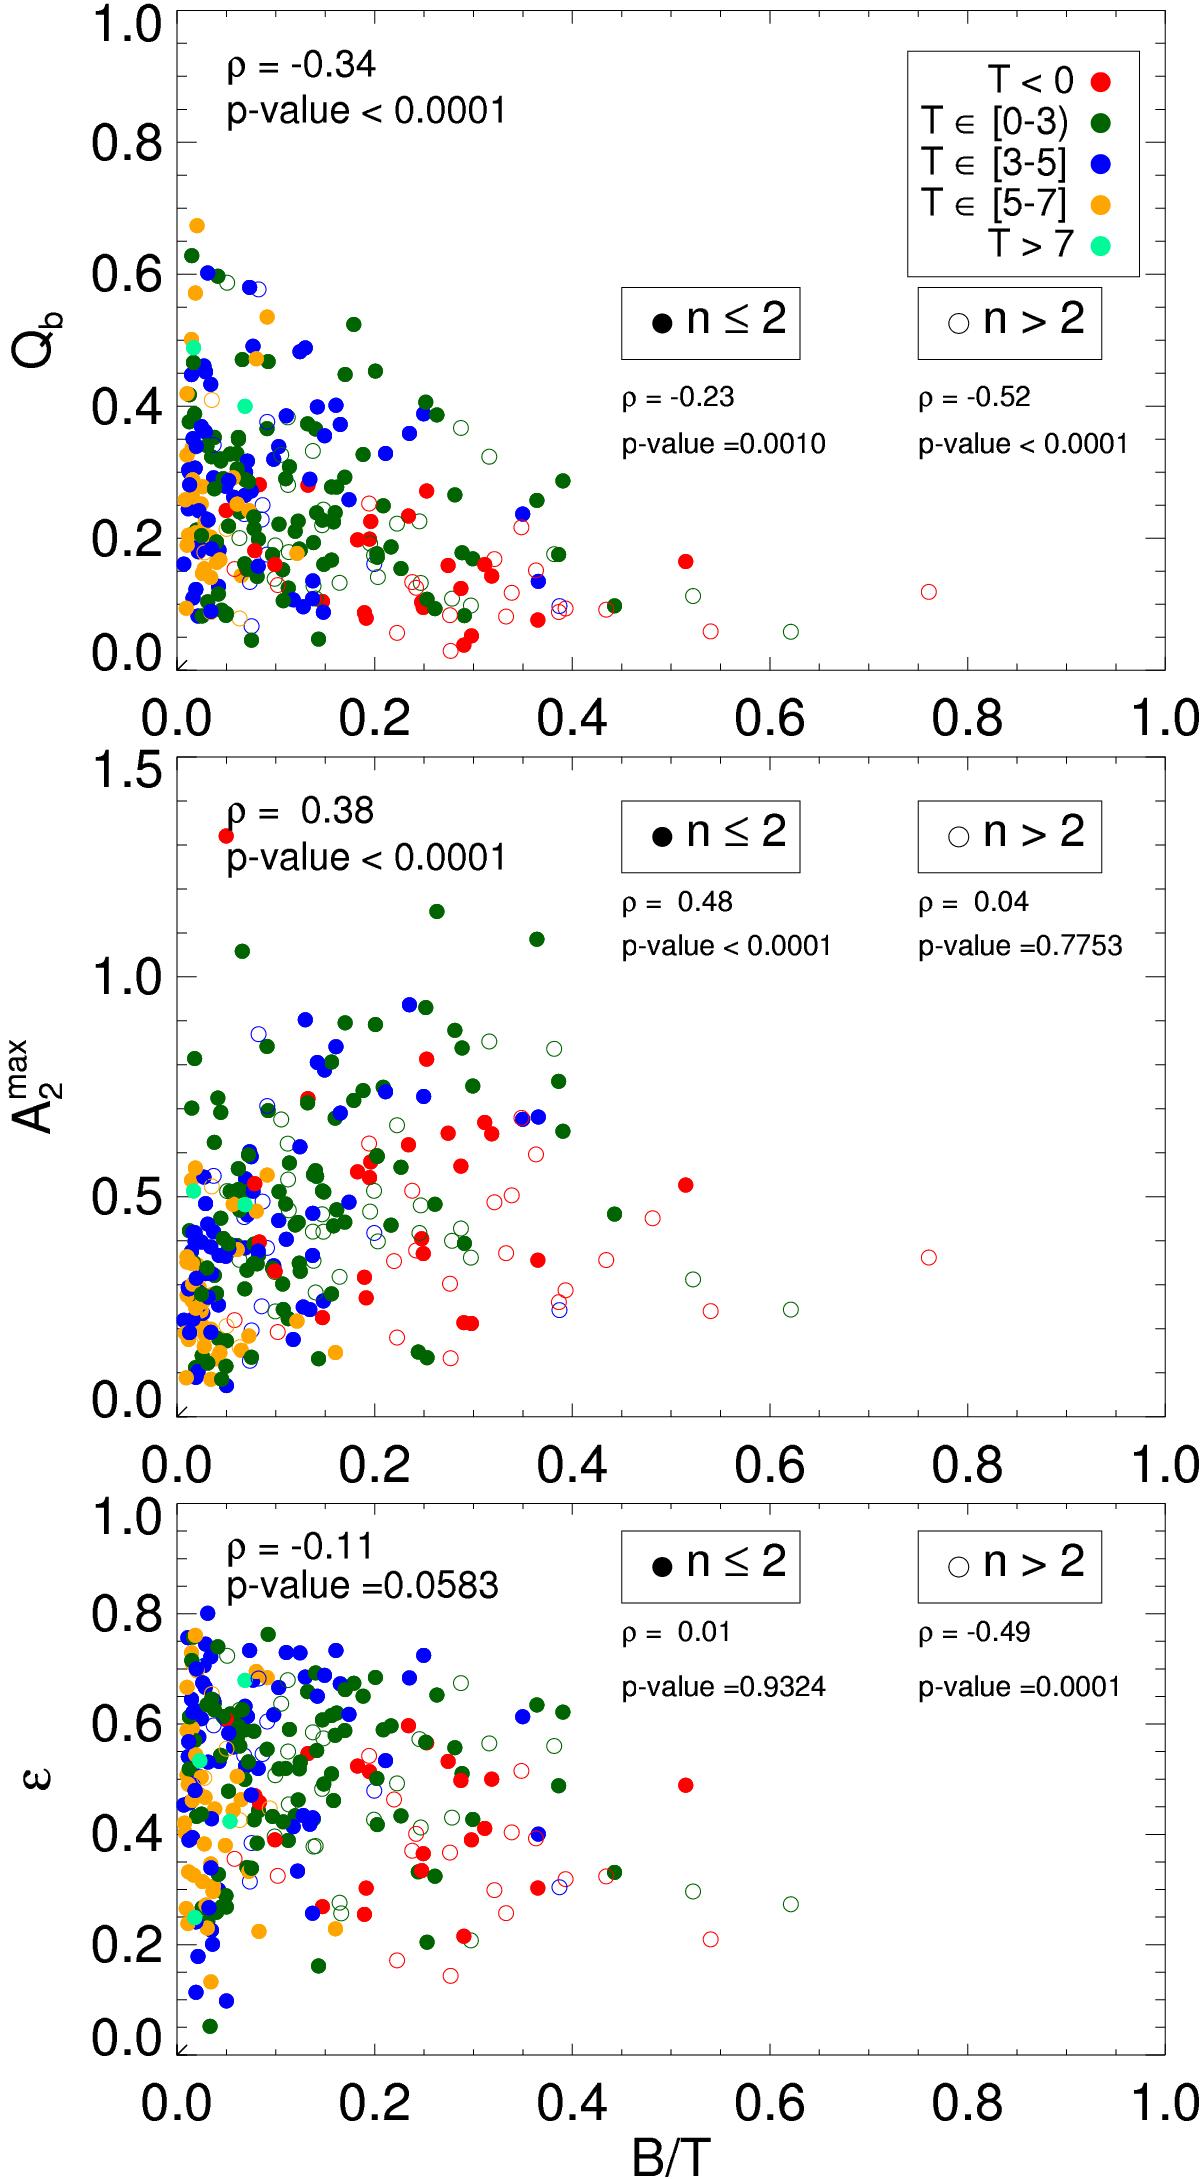
Bar strength indicators dependence on P4 bulge parameters. Spearman’s rank correlation coefficient and significance are displayed in each plot. The Qb, ![]() , and ε as a function of the P4 bulge-to-total ratio are plotted in rows 1–3. Colour indicates the galaxy morphological type. Open symbols indicate bulges with a Sérsic index n> 2, while filled circles correspond to n ≤ 2.
, and ε as a function of the P4 bulge-to-total ratio are plotted in rows 1–3. Colour indicates the galaxy morphological type. Open symbols indicate bulges with a Sérsic index n> 2, while filled circles correspond to n ≤ 2.
Current usage metrics show cumulative count of Article Views (full-text article views including HTML views, PDF and ePub downloads, according to the available data) and Abstracts Views on Vision4Press platform.
Data correspond to usage on the plateform after 2015. The current usage metrics is available 48-96 hours after online publication and is updated daily on week days.
Initial download of the metrics may take a while.