Fig. 23
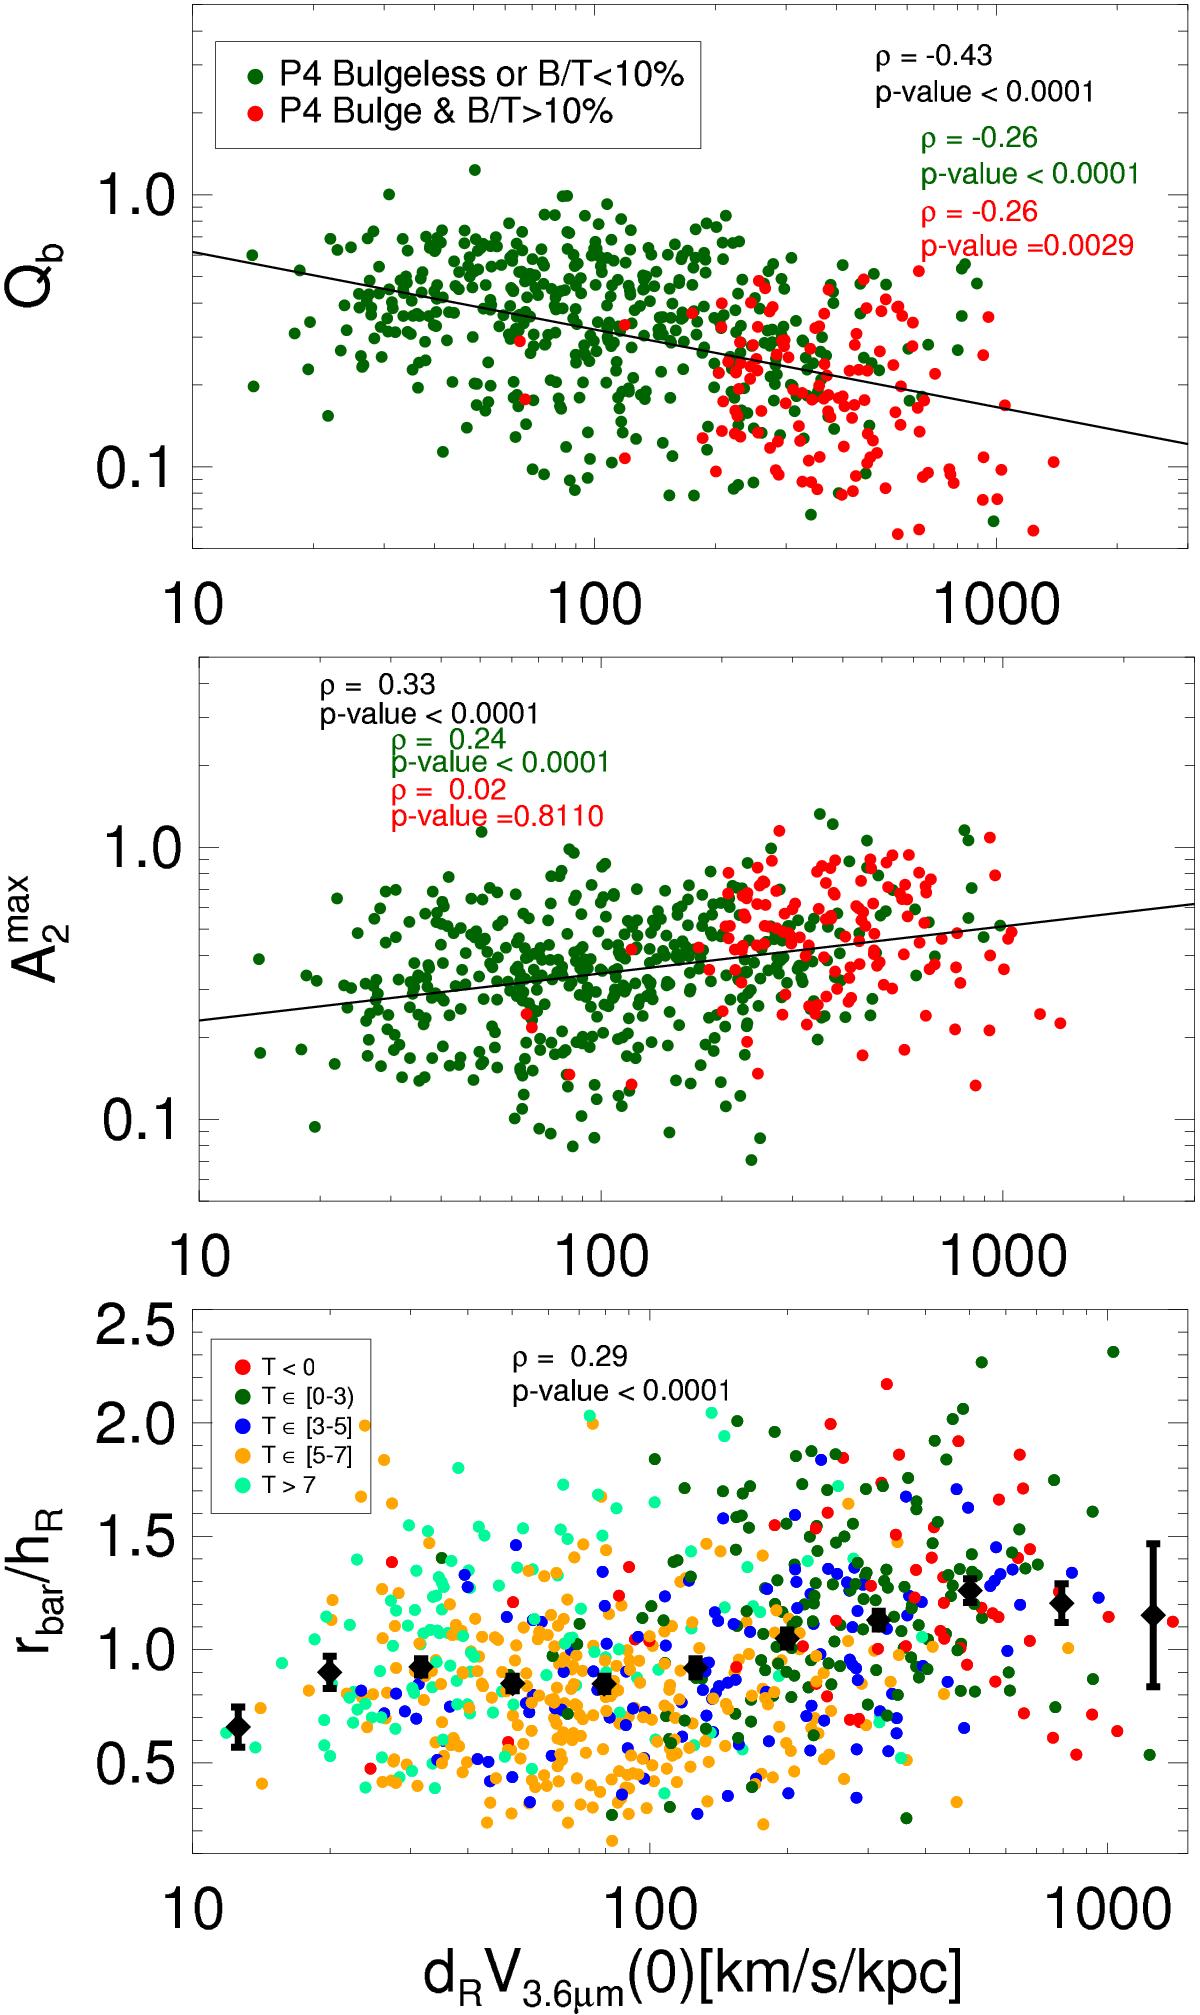
Inner slope of the stellar component of the rotation curve as a function of ![]() , Qb and the normalized bar length. The Spearman’s rank correlation coefficient and significance are displayed together with the linear fit of the cloud of points. For the first two panels, galaxies with and without massive bulges are studied separately, while for the lower plot colours are chosen based on T, indicating the moving average with black symbols.
, Qb and the normalized bar length. The Spearman’s rank correlation coefficient and significance are displayed together with the linear fit of the cloud of points. For the first two panels, galaxies with and without massive bulges are studied separately, while for the lower plot colours are chosen based on T, indicating the moving average with black symbols.
Current usage metrics show cumulative count of Article Views (full-text article views including HTML views, PDF and ePub downloads, according to the available data) and Abstracts Views on Vision4Press platform.
Data correspond to usage on the plateform after 2015. The current usage metrics is available 48-96 hours after online publication and is updated daily on week days.
Initial download of the metrics may take a while.