Fig. C.1
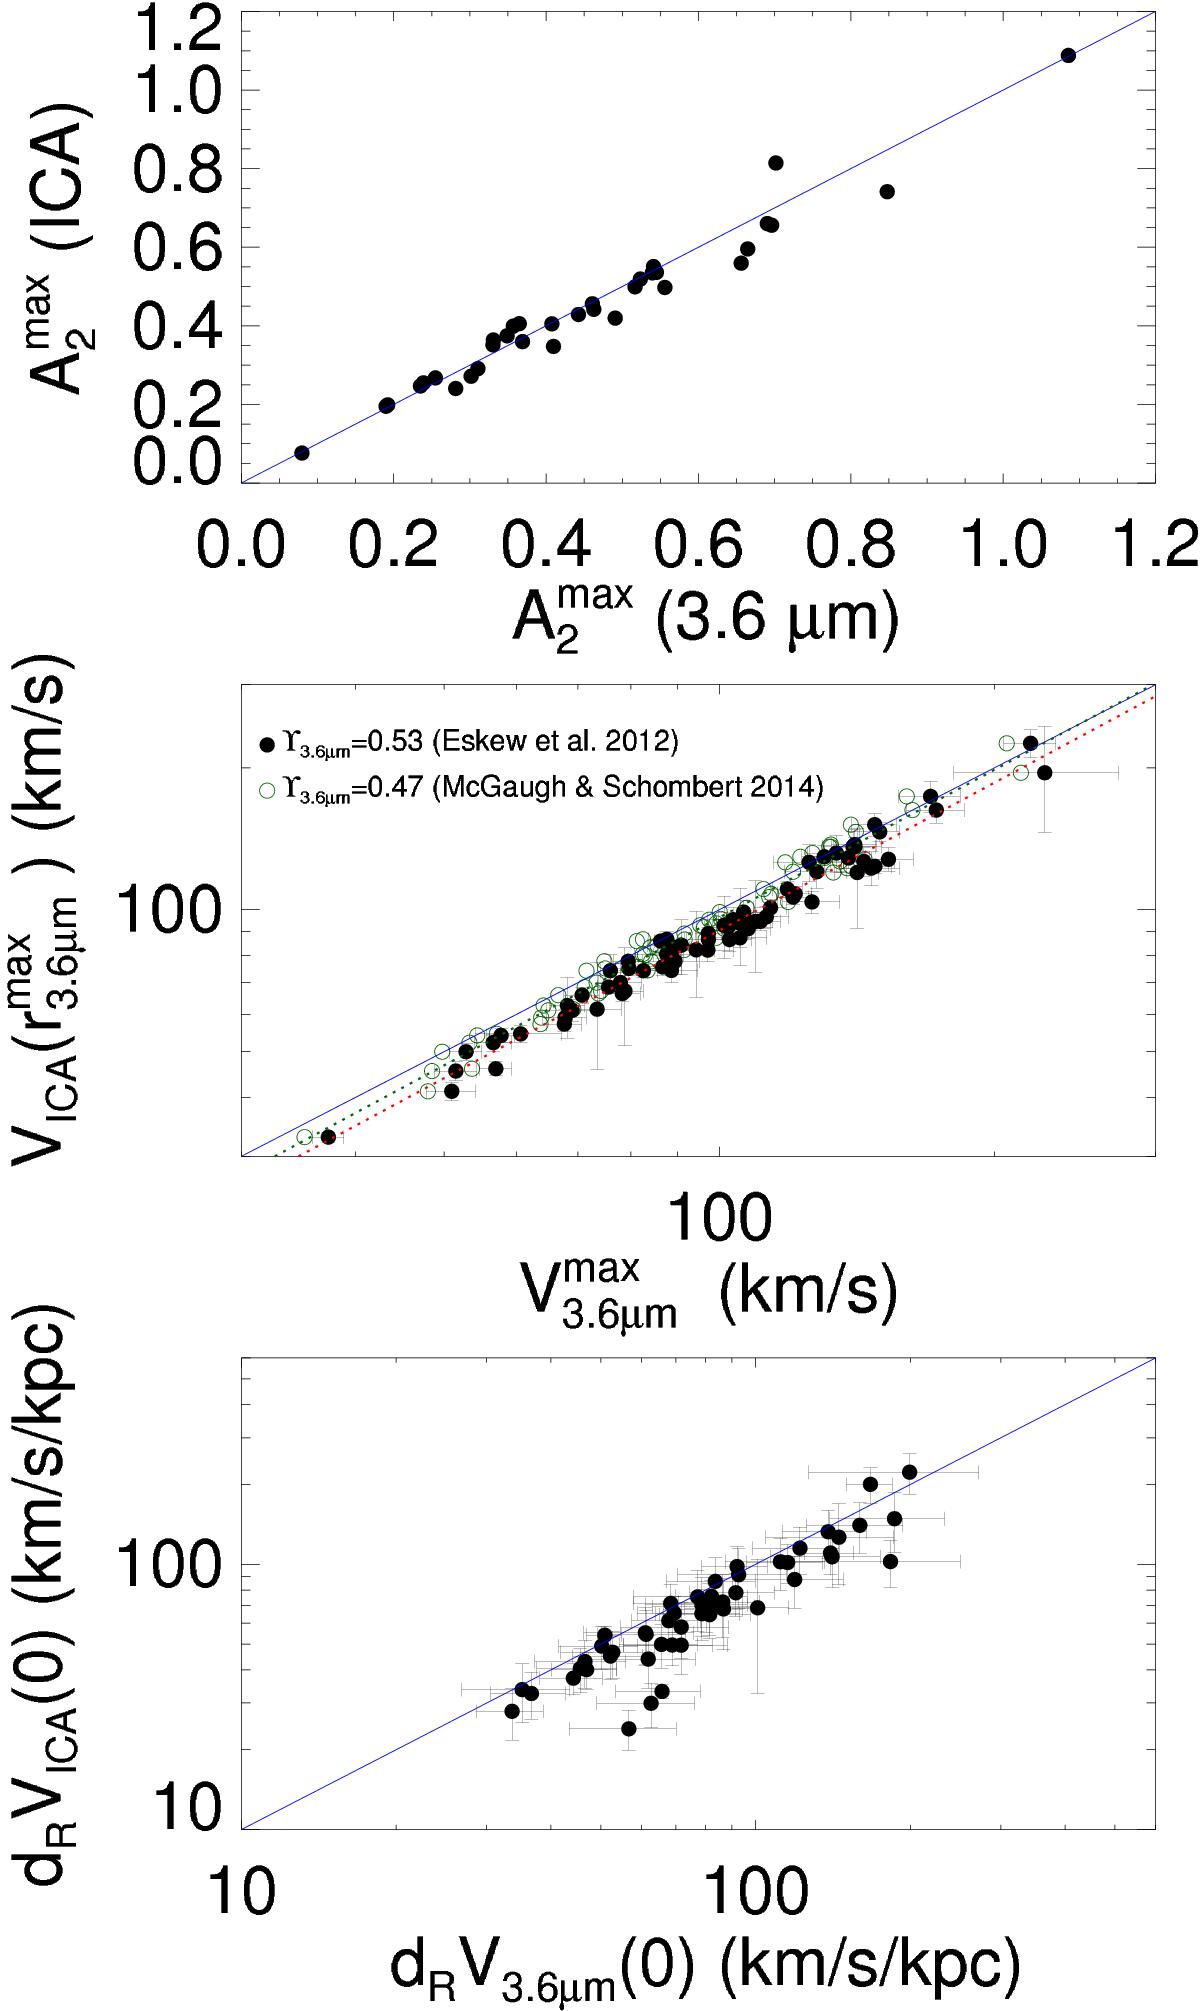
For a sample of S4G galaxies, we compare the bar maximum normalized m = 2 Fourier amplitude (upper panel) as measured over 3.6 μm and ICA-corrected maps. Likewise, stellar velocities and inner slopes obtained from 3.6 μm (M/L = 0.53 from E2012) and mass maps (M/L = 0.6 from Meidt et al. 2014) are compared (central and lower panels). Error bars are computed based on boundary disk thicknesses, but the uncertainties coming from the M/L are indeed larger. A lower mass-to-light ratio at 3.6 μm, M/L = 0.47 (McGaugh & Schombert 2014; Querejeta et al. 2015), is also tested for the comparison of maximum velocities of the stellar component of the rotation curve (green empty circles in the central panel). The result from the statistical tests and the number of galaxies in the different subsamples are indicated in Table C.1. When the uncertainty in dRV3.6 μm(0) associated with the disk thickness is larger than 75 km s-1 kpc-1 (upper limit arbitrarily chosen), we exclude the galaxies from the statistics presented in this section.
Current usage metrics show cumulative count of Article Views (full-text article views including HTML views, PDF and ePub downloads, according to the available data) and Abstracts Views on Vision4Press platform.
Data correspond to usage on the plateform after 2015. The current usage metrics is available 48-96 hours after online publication and is updated daily on week days.
Initial download of the metrics may take a while.