Fig. D.2
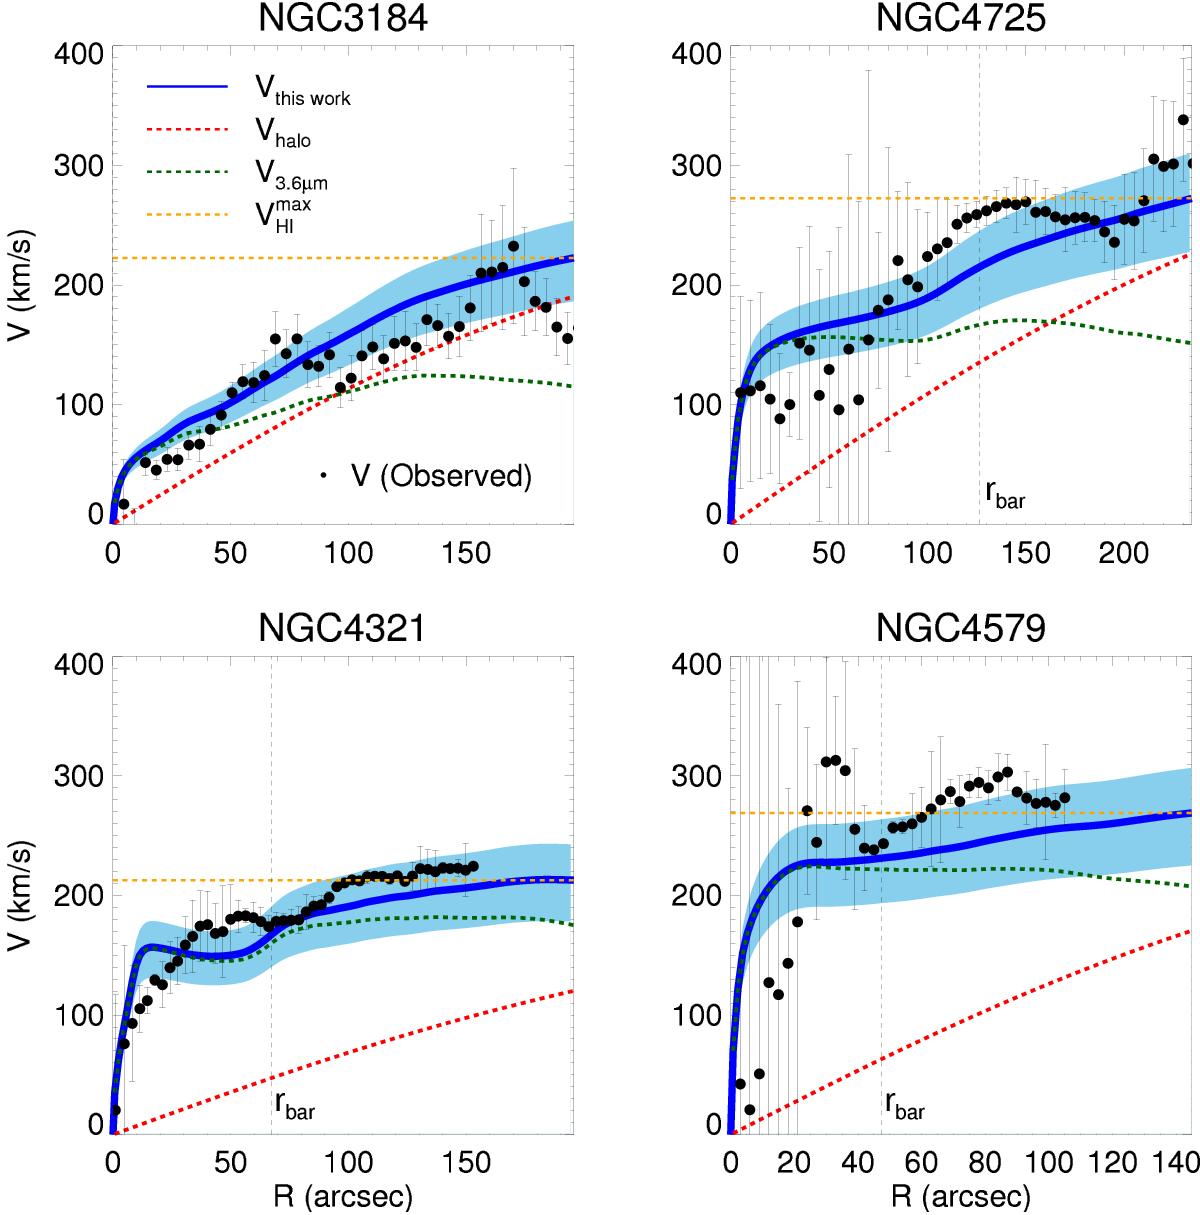
Rotation curve decomposition models for a subsample of 4 galaxies from the SINGS sample (Kennicutt et al. 2003) with disk inclinations lower than 65° and the Hα rotation curves from Daigle et al. (2006) and Dicare et al. (2008). The RCs have been corrected for inclination using P4 orientations. The legend in the first pannel shows the meaning of the different lines and points. For every pannel, the x-axis indicates the galactocentric radius in units of arcsec (limited to the optical radius, ~3.2 hR) and the y-axis corresponds to the rotation velocity in units of km s-1. The shaded area shows the uncertainty in our rotation curve models due to a 30% uncertainty in the M/L ratio. Galaxy RCs are sorted in terms of their mass (increasing from left to right, top to bottom).


Current usage metrics show cumulative count of Article Views (full-text article views including HTML views, PDF and ePub downloads, according to the available data) and Abstracts Views on Vision4Press platform.
Data correspond to usage on the plateform after 2015. The current usage metrics is available 48-96 hours after online publication and is updated daily on week days.
Initial download of the metrics may take a while.