Fig. E.1
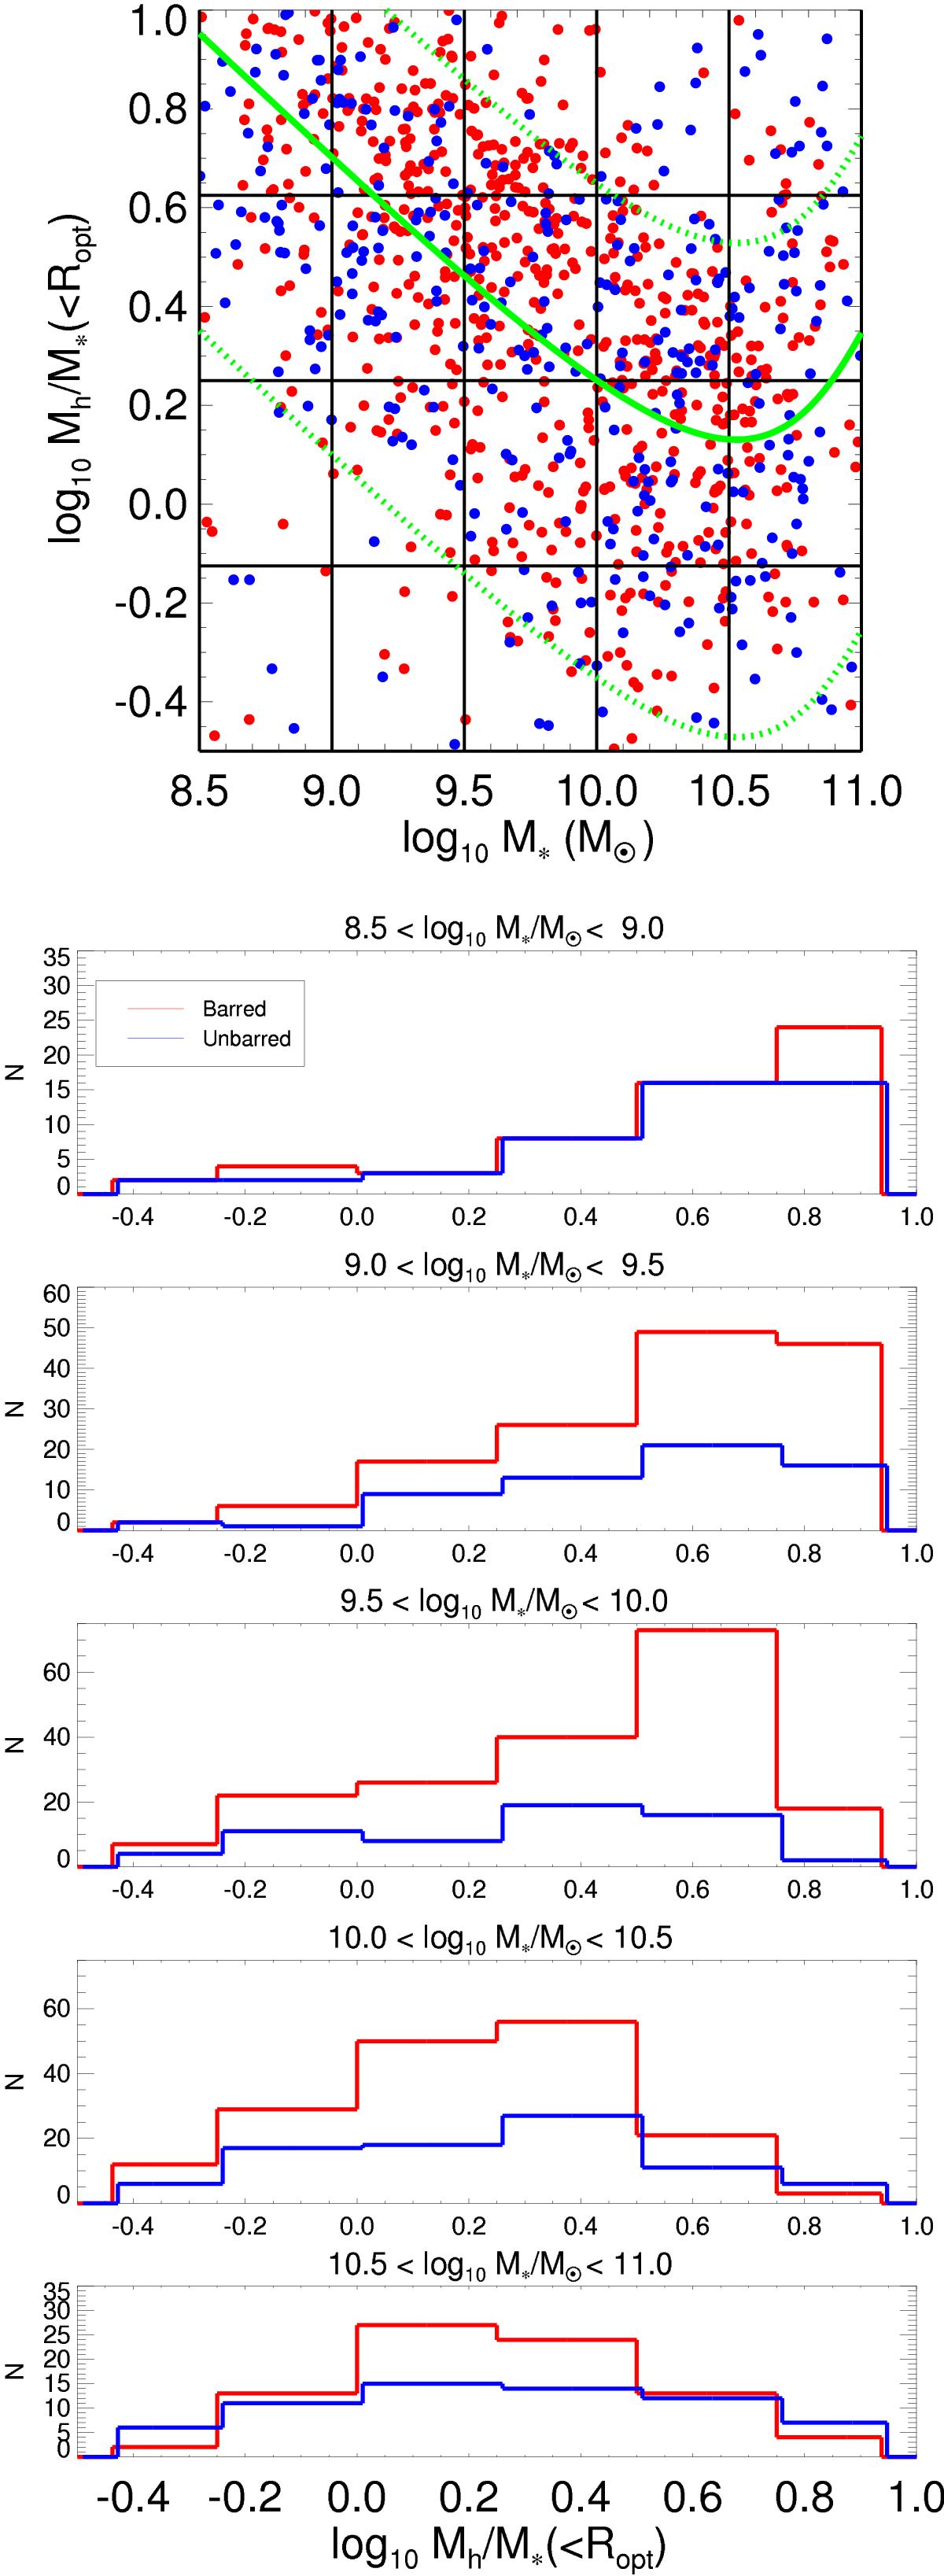
Co-dependence between halo-to-stellar mass ratio, the total stellar mass, and the bar fraction (B2015) are studied by binning the Mh/M∗-M∗ space. In the upper panel, red and blue filled circles correspond to barred and non-barred galaxies, respectively. For a given stellar mass interval, we display the distribution of barred and non-barred galaxies vs. Mh/M∗. P-values after performing a two-sample K-S test are listed in Table E.1): according to the test, the differences in the distribution of barred and non-barred galaxies are not statistically significant for any of the mass intervals. The green lines correspond to the total halo-to-stellar ratio from Moster et al. (2010) scaled down by constant factors ~0.04 (solid line), ~0.1 and ~0.01 (dashed lines).

Current usage metrics show cumulative count of Article Views (full-text article views including HTML views, PDF and ePub downloads, according to the available data) and Abstracts Views on Vision4Press platform.
Data correspond to usage on the plateform after 2015. The current usage metrics is available 48-96 hours after online publication and is updated daily on week days.
Initial download of the metrics may take a while.