Fig. 4
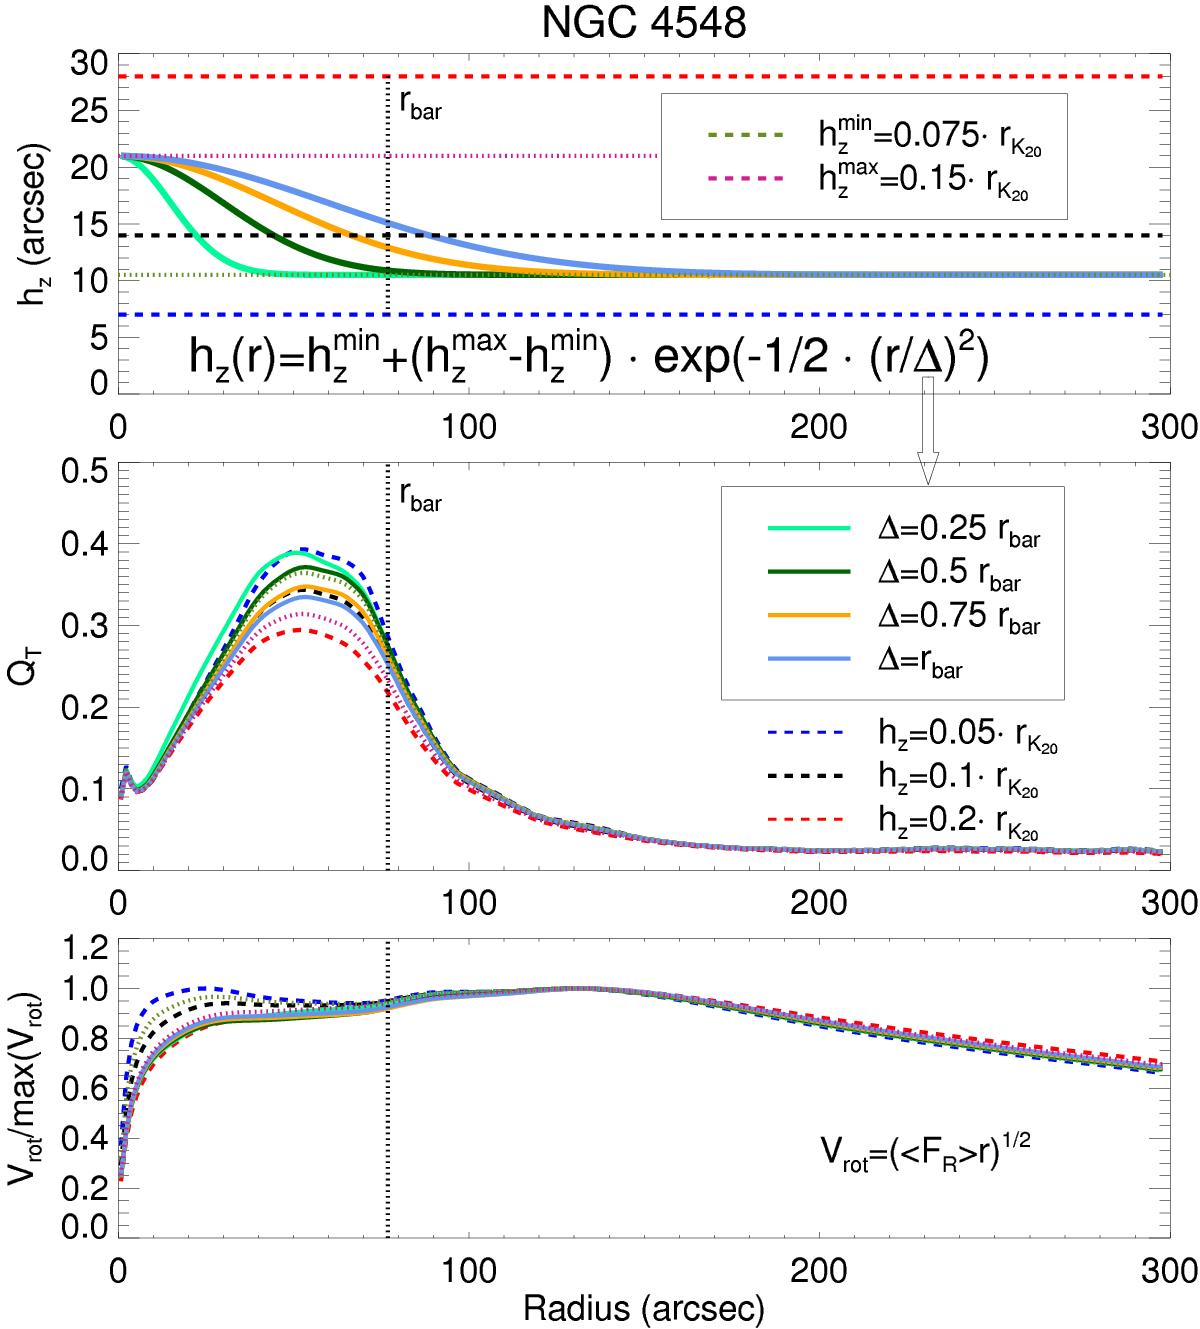
First panel: we compare different models of a disk scale hight profile for NGC 4548. The profiles assume a Gaussian function, with the spread Δ defined in terms of the bar size. The black horizontal dashed line represents the nominal thickness to this particular galaxy, while the uppermost and lowermost lines correspond to the limits for the disk thickness as determined in Speltincx et al. (2008). Second and third panels: radial force profiles and rotation curves inferred from the potential associated with the distance-dependent exponential scale heights defined above (solid lines) and under the assumption of radially constant disk thickness (dashed lines).
Current usage metrics show cumulative count of Article Views (full-text article views including HTML views, PDF and ePub downloads, according to the available data) and Abstracts Views on Vision4Press platform.
Data correspond to usage on the plateform after 2015. The current usage metrics is available 48-96 hours after online publication and is updated daily on week days.
Initial download of the metrics may take a while.