Fig. 5
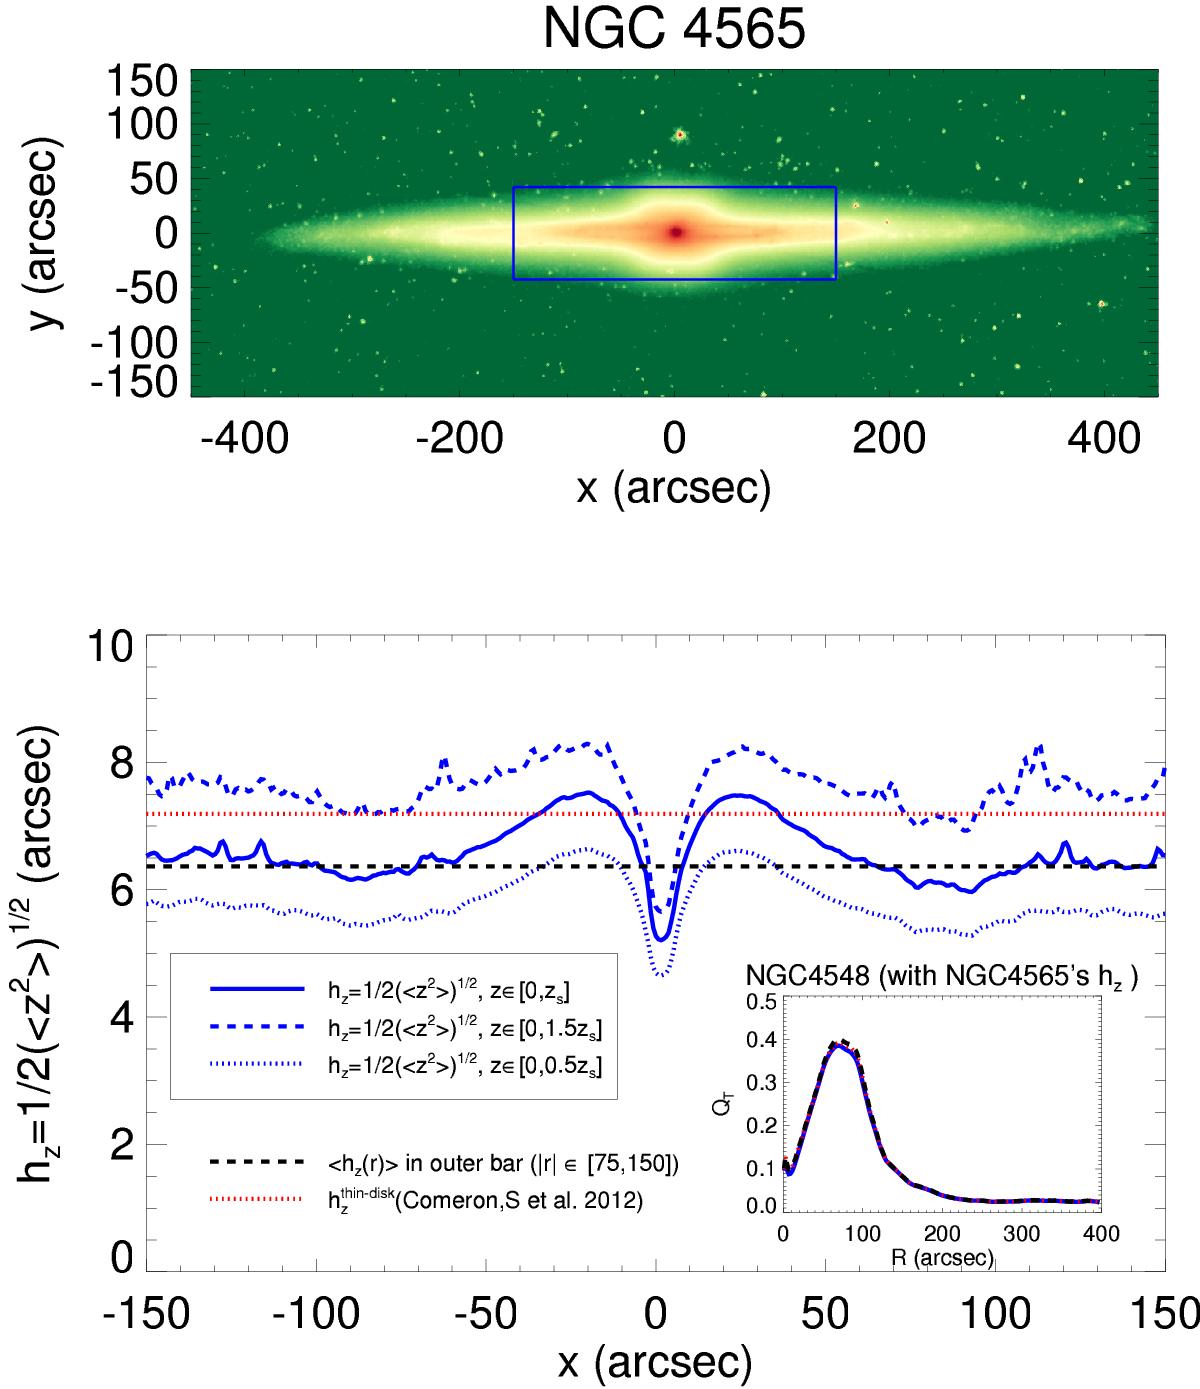
First panel: edge-on galaxy NGC 4565, which hosts a prominent peanut-shaped bar, in magnitude scale with range 17−24 μ3.6 μm(AB). The galaxy has been rotated so that the major axis appears horizontal in the image. The blue box roughly covers the bar region and extends vertically as far as zs, which is the height above which 90% of the light emission comes from the thick disk component. Second panel: disk scale height estimated from the line-of-sight vertical dispersion. The continuous, dashed, and dotted blue lines correspond to the resulting hz integrating up to zs, 1.5zs, and 0.5zs, respectively. For the first case, the black dashed horizontal line shows the mean hz outside the range of the peanut-shaped bar. The horizontal lines trace the thin disk hz estimated from the fits to the vertical luminosity profiles (red). The resulting QT profiles from the different disk scale heights (solid blue, dashed black, and dotted red lines; with the meaning indicated in the legends) are shown in the lower right plot.
Current usage metrics show cumulative count of Article Views (full-text article views including HTML views, PDF and ePub downloads, according to the available data) and Abstracts Views on Vision4Press platform.
Data correspond to usage on the plateform after 2015. The current usage metrics is available 48-96 hours after online publication and is updated daily on week days.
Initial download of the metrics may take a while.