Fig. 6
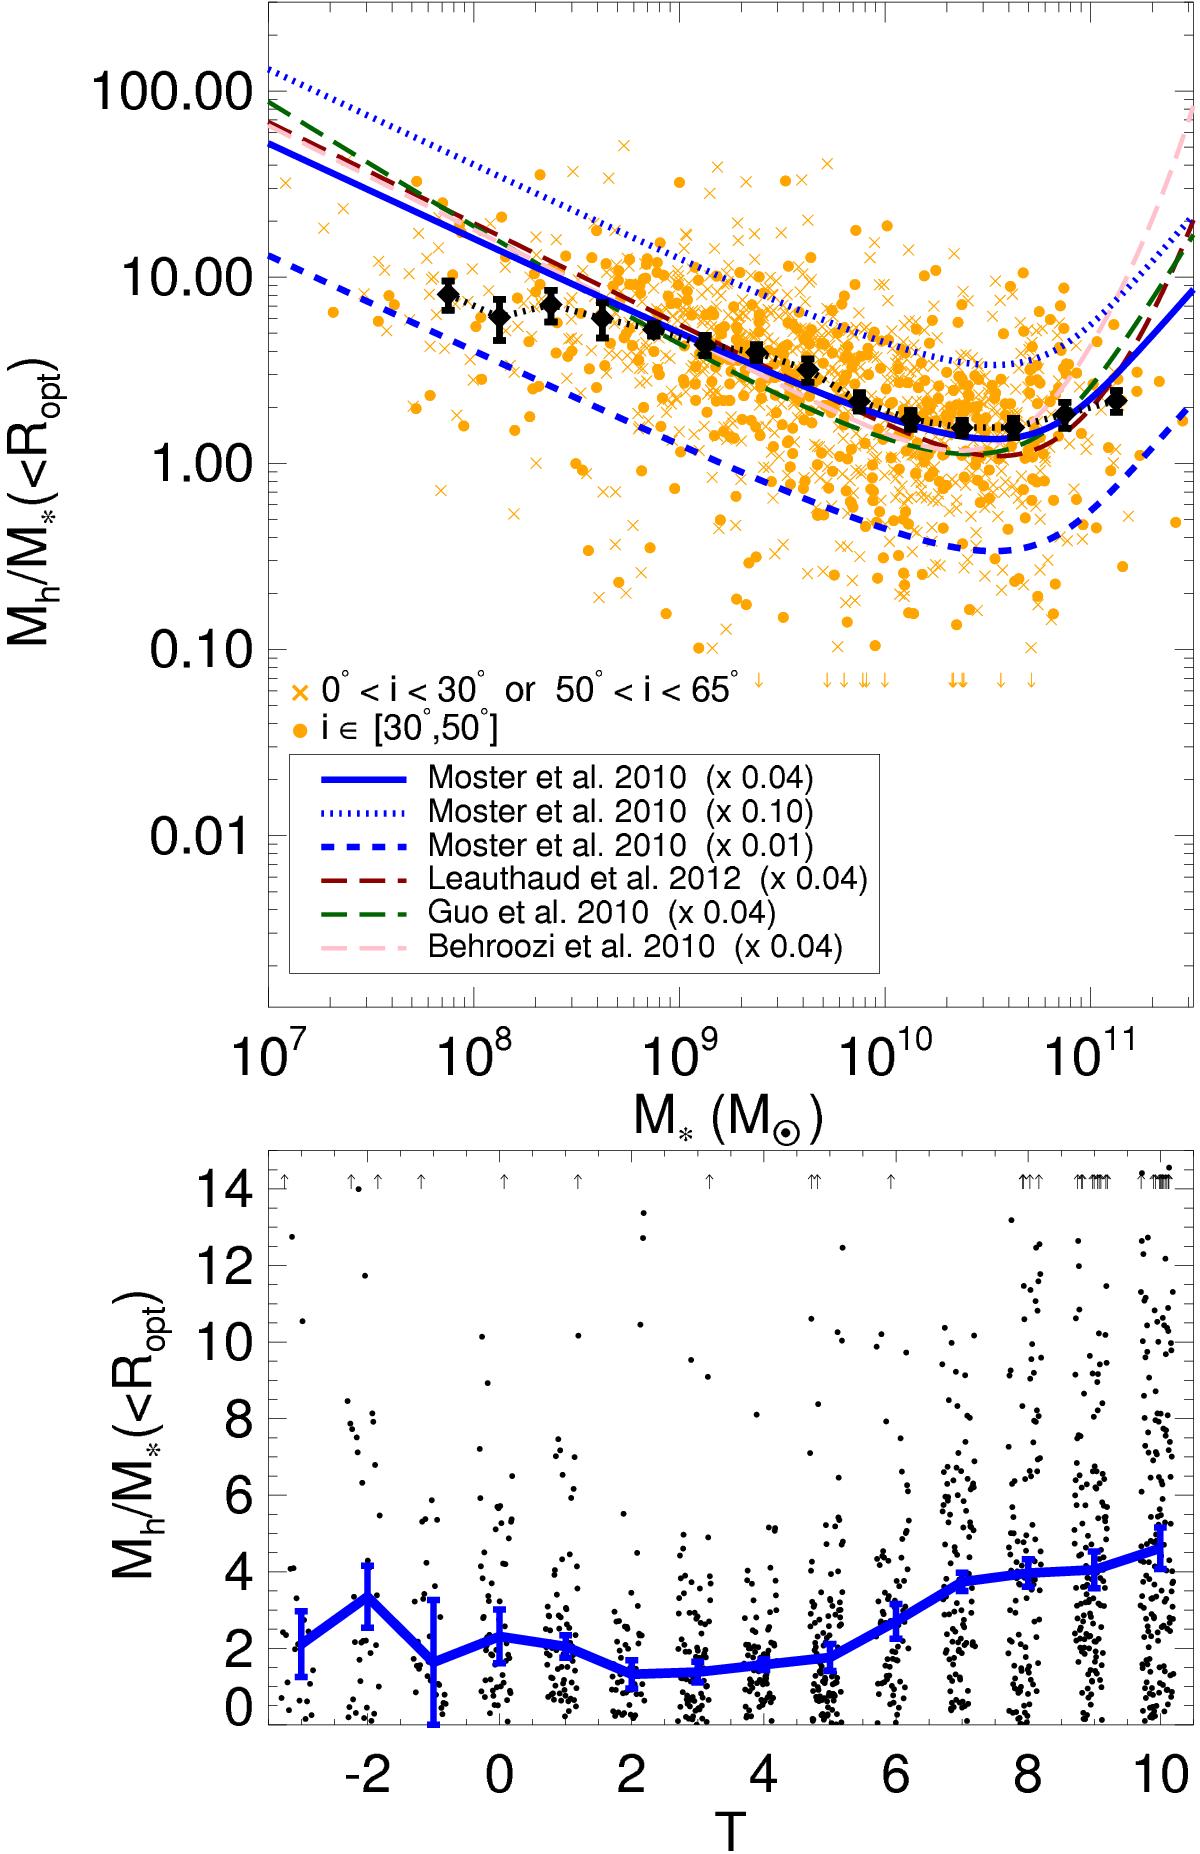
Upper frame: halo-to-stellar mass ratio within the optical radius for the non-highly inclined spiral galaxies (i< 65°) in the S4G sample with usable H i maximum velocities (1227 systems). Galaxies with ![]() km s-1 (gas-poor galaxies with unreliable velocity measurements) are excluded from our statistics. Both barred and non-barred systems form part of this sample. Moderately inclined galaxies (30°<i< 50°) are plotted with orange filled circles, while more inclined and face-on galaxies are displayed with orange X symbols: for both subsamples the statistical trend is practically the same, which means that uncertainties in the velocity measurements due to inclination are not a major issue here. The black dots represent the total running median of our data and the error bars are determined by applying the bootstrapping statistical method. The different lines show the estimates in the literature for the total halo-to-stellar mass ratio once these have been scaled down by the factor specified in the labels. Lower frame: Mh/M∗(<Ropt) as a function of Hubble type. The running median is overplotted in blue (error bars obtained via bootstrapping).
km s-1 (gas-poor galaxies with unreliable velocity measurements) are excluded from our statistics. Both barred and non-barred systems form part of this sample. Moderately inclined galaxies (30°<i< 50°) are plotted with orange filled circles, while more inclined and face-on galaxies are displayed with orange X symbols: for both subsamples the statistical trend is practically the same, which means that uncertainties in the velocity measurements due to inclination are not a major issue here. The black dots represent the total running median of our data and the error bars are determined by applying the bootstrapping statistical method. The different lines show the estimates in the literature for the total halo-to-stellar mass ratio once these have been scaled down by the factor specified in the labels. Lower frame: Mh/M∗(<Ropt) as a function of Hubble type. The running median is overplotted in blue (error bars obtained via bootstrapping).
Current usage metrics show cumulative count of Article Views (full-text article views including HTML views, PDF and ePub downloads, according to the available data) and Abstracts Views on Vision4Press platform.
Data correspond to usage on the plateform after 2015. The current usage metrics is available 48-96 hours after online publication and is updated daily on week days.
Initial download of the metrics may take a while.