Fig. 3
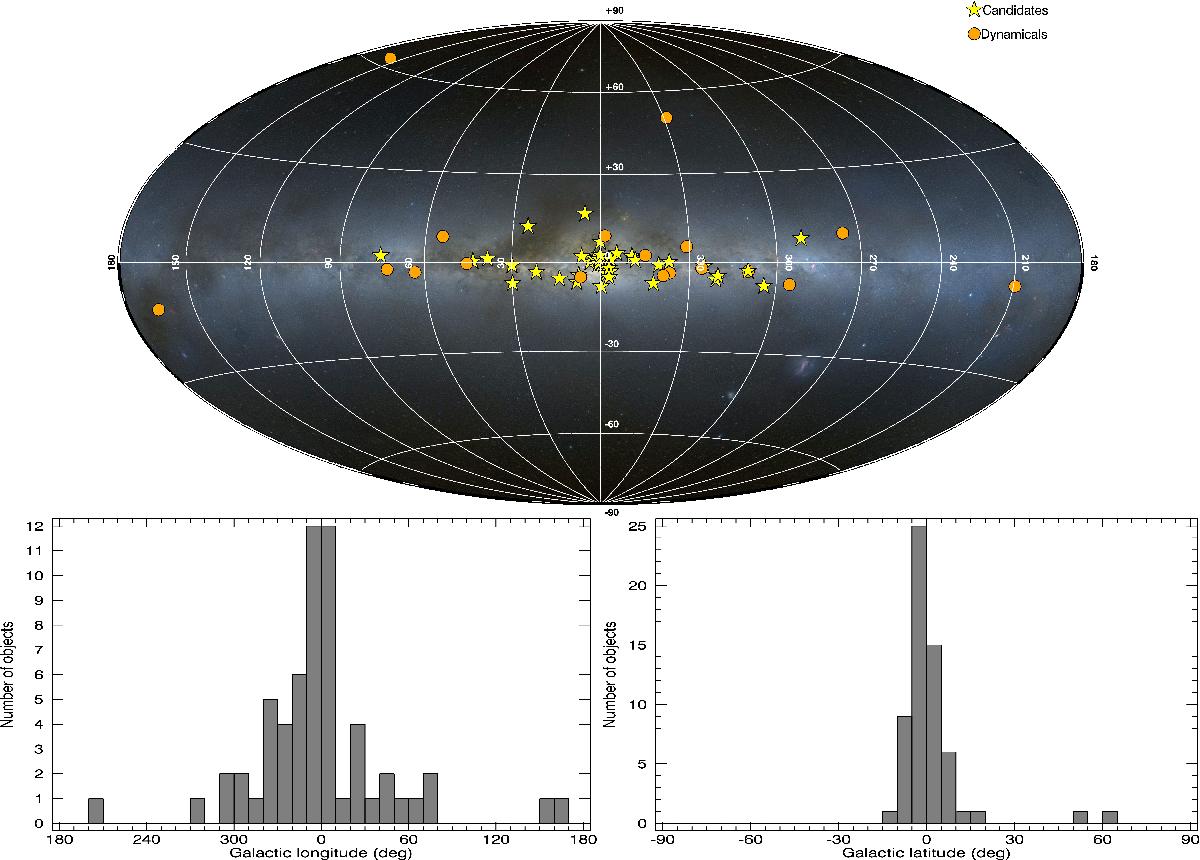
Top: the distribution of dynamically confirmed BHs (circles) and BH candidates (stars) in the Galactic plane, using the Hammer projection. (Background image credit: Mellinger 2009). Some of the symbols are overlapped by others, especially in the Galactic centre region. Bottom: histogram of the distribution of BH transients in Galactic longitude (left) and latitude (right). A 10° bin size in longitude and 5° bin in latitude were used respectively.
Current usage metrics show cumulative count of Article Views (full-text article views including HTML views, PDF and ePub downloads, according to the available data) and Abstracts Views on Vision4Press platform.
Data correspond to usage on the plateform after 2015. The current usage metrics is available 48-96 hours after online publication and is updated daily on week days.
Initial download of the metrics may take a while.