Fig. 10
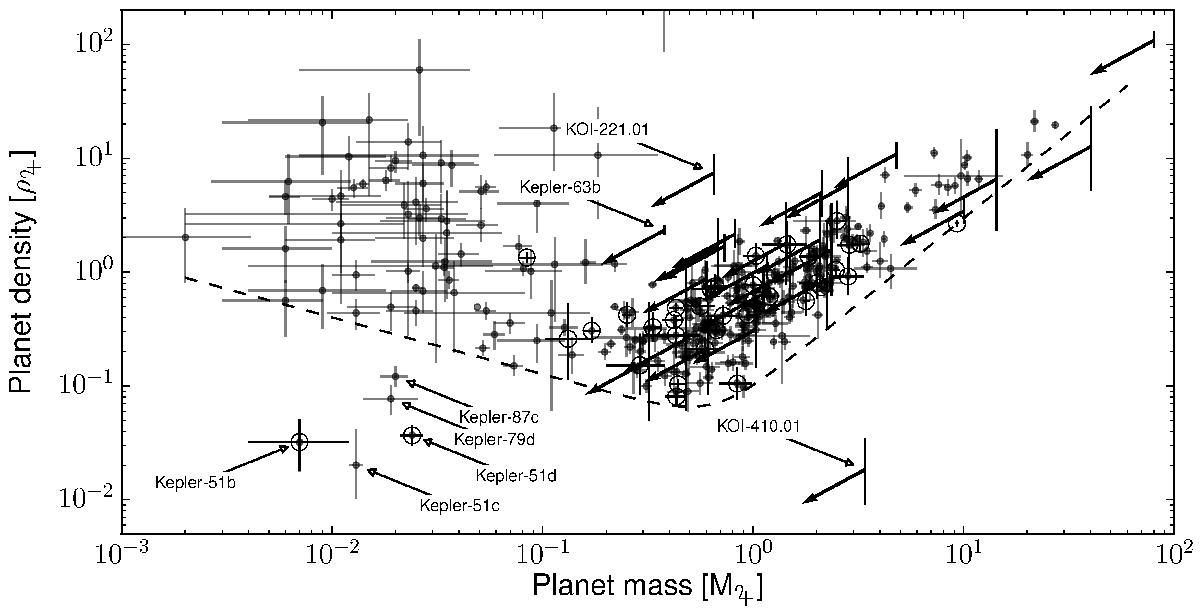
Hatzes & Rauer (2016) diagram of exoplanets, showing the bulk density as function of their mass. The open circles are the giant planets defined in our sample and the dots are other planets. We kept as planets only those with a density characterised at a level better than 1σ. The arrows represent the candidates in our sample for which it was only possible to derive an upper limit on their mass (see Table B.4). The vertical bars attached to the arrow are the uncertainties on the densities imposed by the uncertainties on the radii. The dashed line represents the empirical lower envelope density for giant and low-mass planets (see Eq. (5)).
Current usage metrics show cumulative count of Article Views (full-text article views including HTML views, PDF and ePub downloads, according to the available data) and Abstracts Views on Vision4Press platform.
Data correspond to usage on the plateform after 2015. The current usage metrics is available 48-96 hours after online publication and is updated daily on week days.
Initial download of the metrics may take a while.