Fig. 4
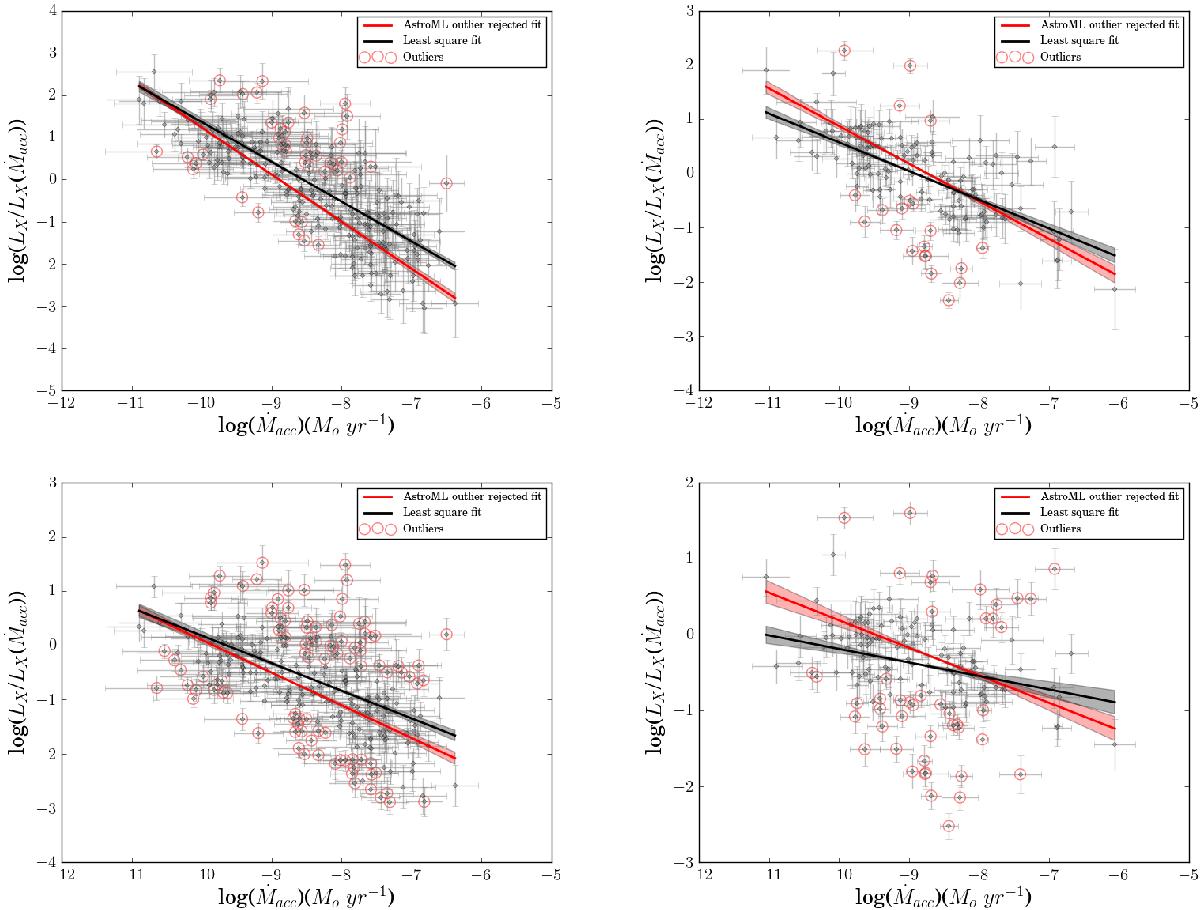
Residual X-ray luminosity, after normalization with the M – LX and M – Ṁ relations, as a function of the mass accretion rate. Left figures correspond to the Hα subsample. Right figures correspond to the U-excess subsample. The top plots present the results using the OLS method for the initial regression analyses between M∗, LX and Ṁacc. The bottom ones when using the outlier rejection method for those same analyses. Regression lines (straight), with their respective errors in the slope (shaded areas), are shown for the OLS (black) and outlier rejection (red) final regression results.
Current usage metrics show cumulative count of Article Views (full-text article views including HTML views, PDF and ePub downloads, according to the available data) and Abstracts Views on Vision4Press platform.
Data correspond to usage on the plateform after 2015. The current usage metrics is available 48-96 hours after online publication and is updated daily on week days.
Initial download of the metrics may take a while.