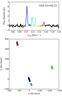
Fig. 1
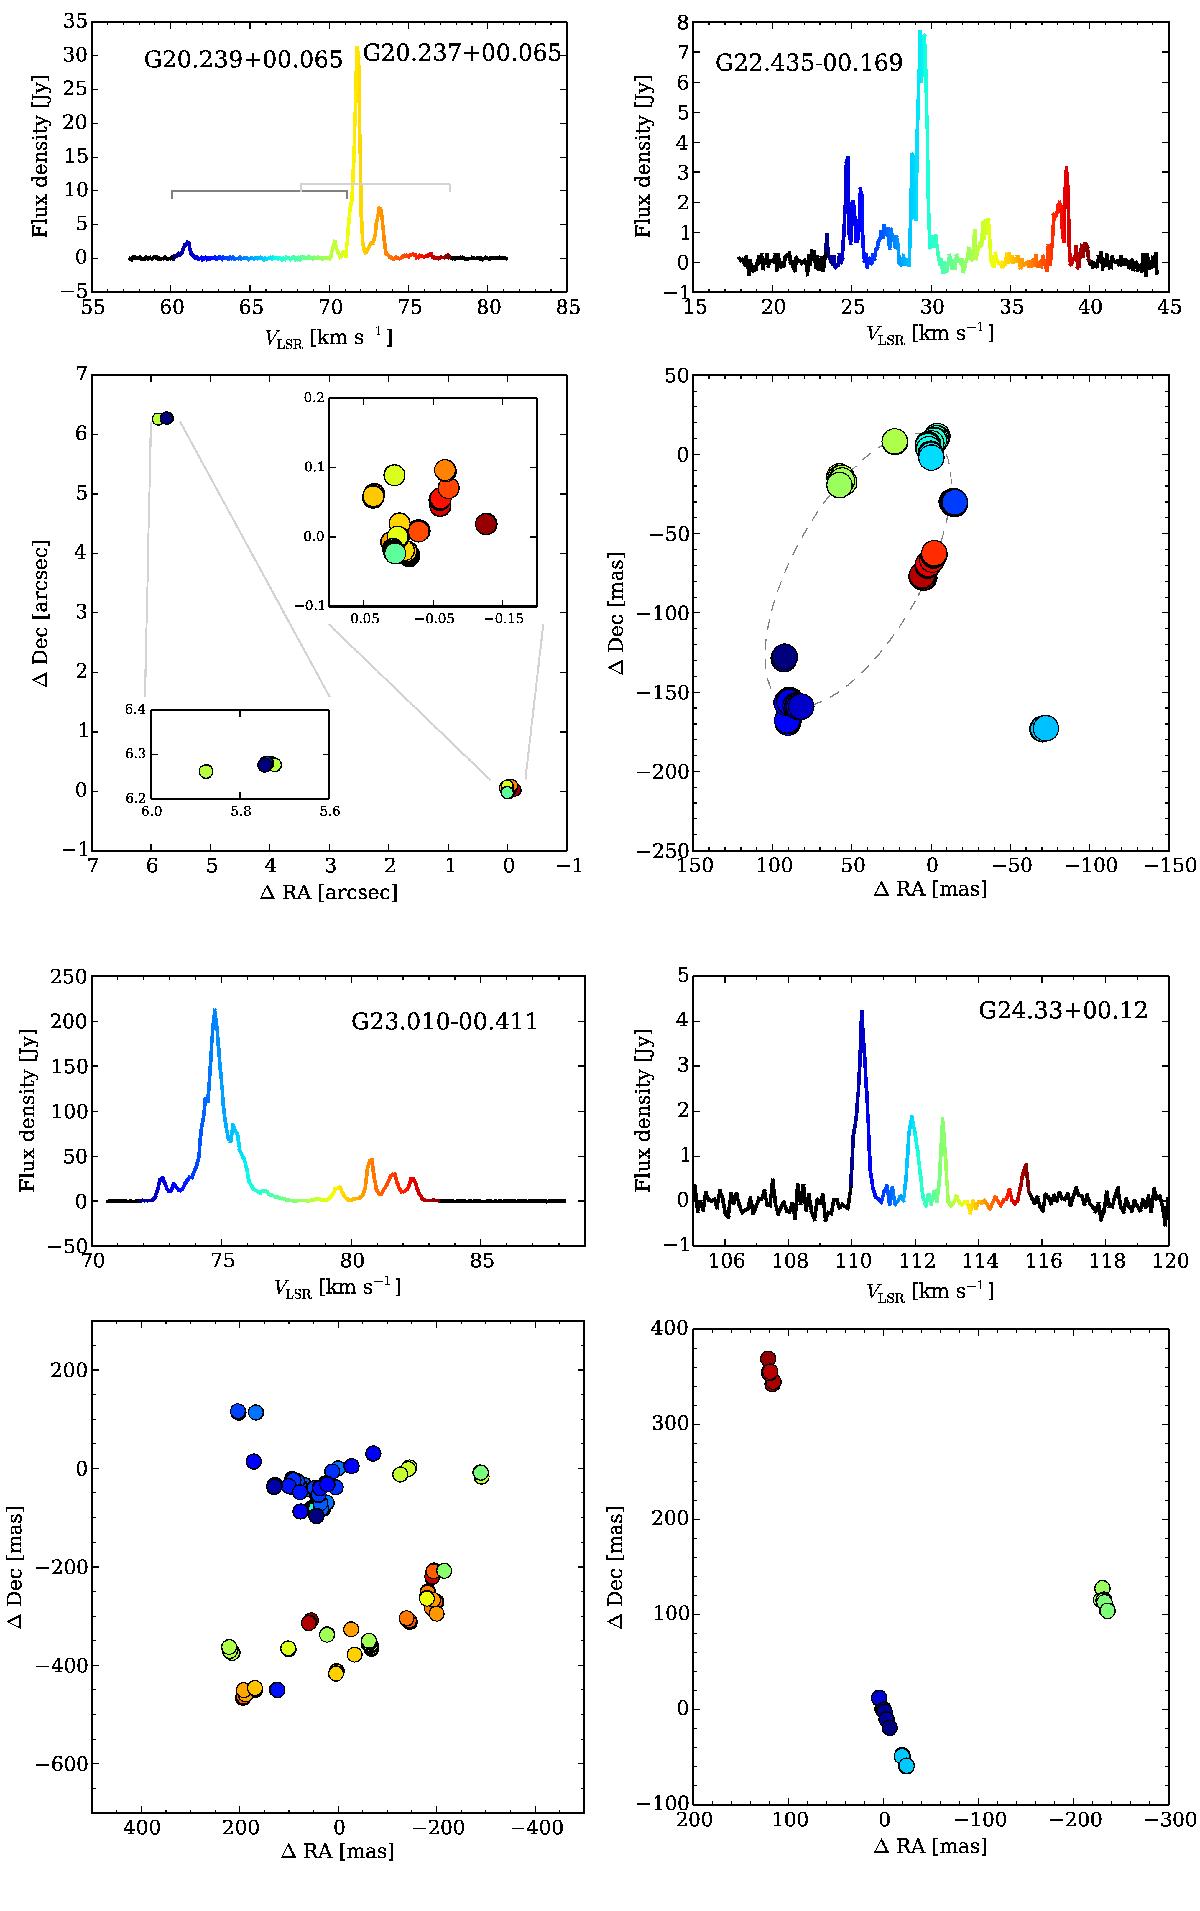
Spectra and maps of 6.7 GHz methanol masers detected using the EVN. The names are the Galactic coordinates of the brightest spots listed in Table 2 (the (0, 0) locations).The colours of circles relate to the LSR velocities as shown in the spectra. Note, that in the first target the scale in distribution is presented in arcsec, while the rest of sources are described by a mas scale. The grey ellipses mark the best-fit ellipses for the sources with the ring-like morphology. The plots for the remaining targets are presented in Appendix A.
Current usage metrics show cumulative count of Article Views (full-text article views including HTML views, PDF and ePub downloads, according to the available data) and Abstracts Views on Vision4Press platform.
Data correspond to usage on the plateform after 2015. The current usage metrics is available 48-96 hours after online publication and is updated daily on week days.
Initial download of the metrics may take a while.