Fig. 5
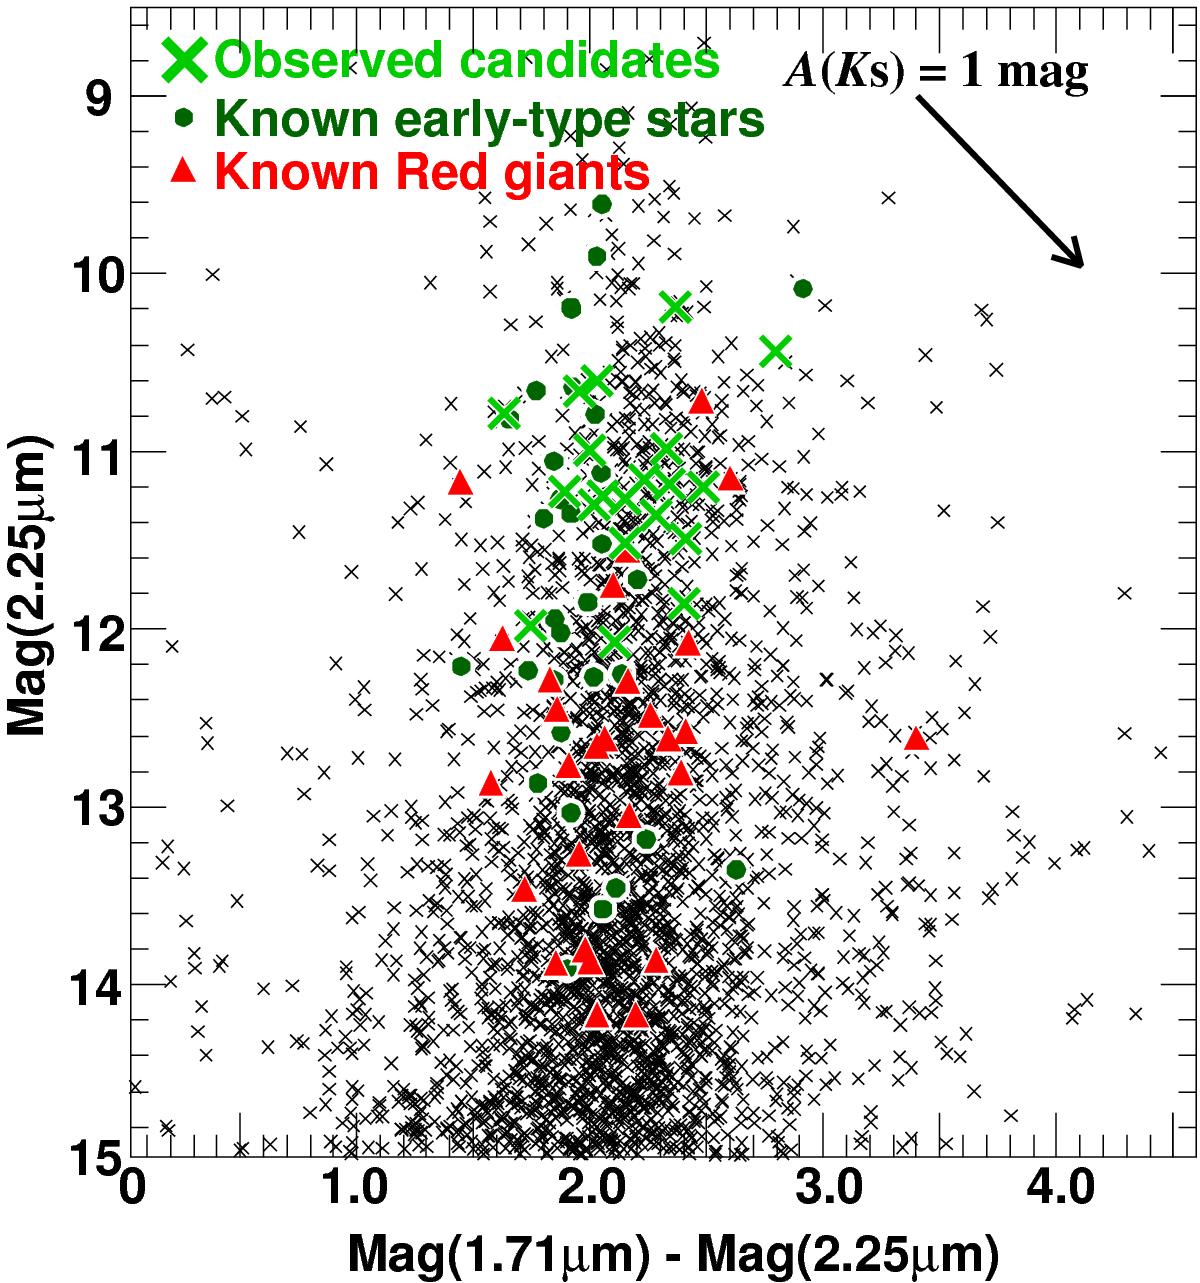
[2.25] vs. [1.71]–[2.25] color magnitude diagram for sources measured in Nishiyama & Schödel (2013). The observed early-type star candidates in this work are overplotted by light green ×s. Dark green circles and red triangles represent spectroscopically identified early-type stars and late-type giants in the Galactic NSC, respectively.
Current usage metrics show cumulative count of Article Views (full-text article views including HTML views, PDF and ePub downloads, according to the available data) and Abstracts Views on Vision4Press platform.
Data correspond to usage on the plateform after 2015. The current usage metrics is available 48-96 hours after online publication and is updated daily on week days.
Initial download of the metrics may take a while.