Fig. 10
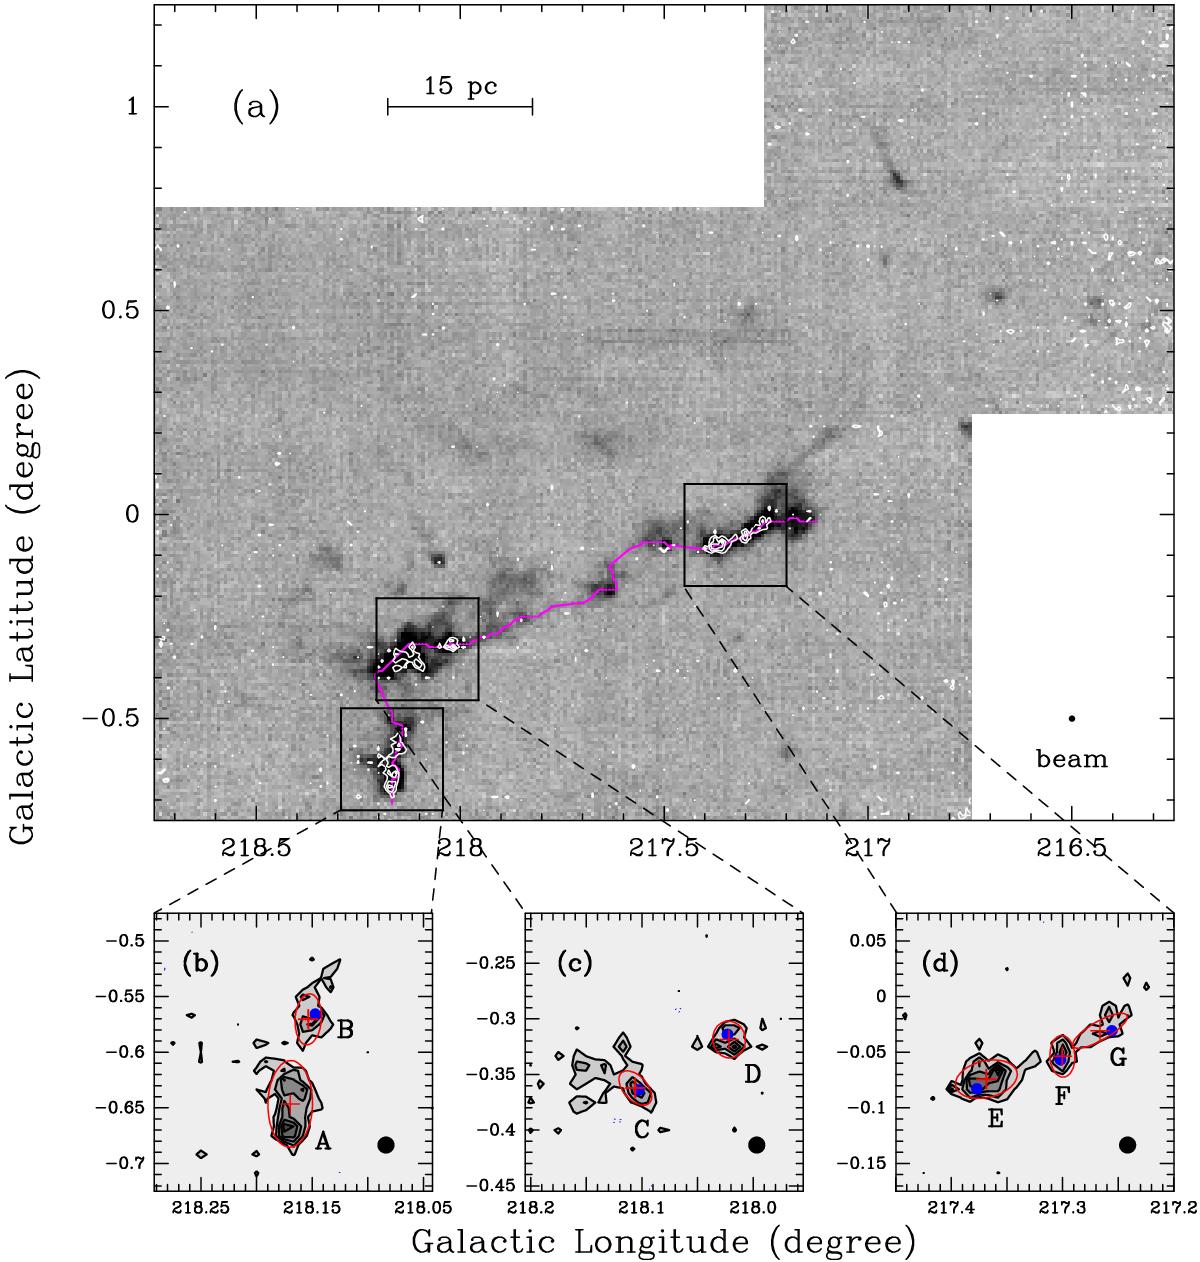
a) C18O intensity map (white contours) overlaid on the 13CO line image. Both lines have been integrated over the velocity range between 22 and 29 km s-1. Contours start from 1.2 K km s-1(3σ) to 3.6 K km s-1(9σ) by 0.8 K km s-1(2σ). The horizontal bar represents 15 pc at the distance of 2.42 kpc. The purple solid line marks the highest H2 column density line of the filament S287-main along its long axis. b) Zoom in the region indicated in Fig. 10a. Contours start from 1.2 K km s-1(3σ) to 3.6 K km s-1(9σ) by 0.6 K km s-1(1.5σ). The clumps are marked with red crosses and ellipses, and their corresponding names are also given. The RMS MYSOs are marked with blue circles. The C18O beam width is shown in the lower right corner of the panel. c) Same as Fig. 10b. d) Same as Fig. 10b.
Current usage metrics show cumulative count of Article Views (full-text article views including HTML views, PDF and ePub downloads, according to the available data) and Abstracts Views on Vision4Press platform.
Data correspond to usage on the plateform after 2015. The current usage metrics is available 48-96 hours after online publication and is updated daily on week days.
Initial download of the metrics may take a while.