Fig. 12
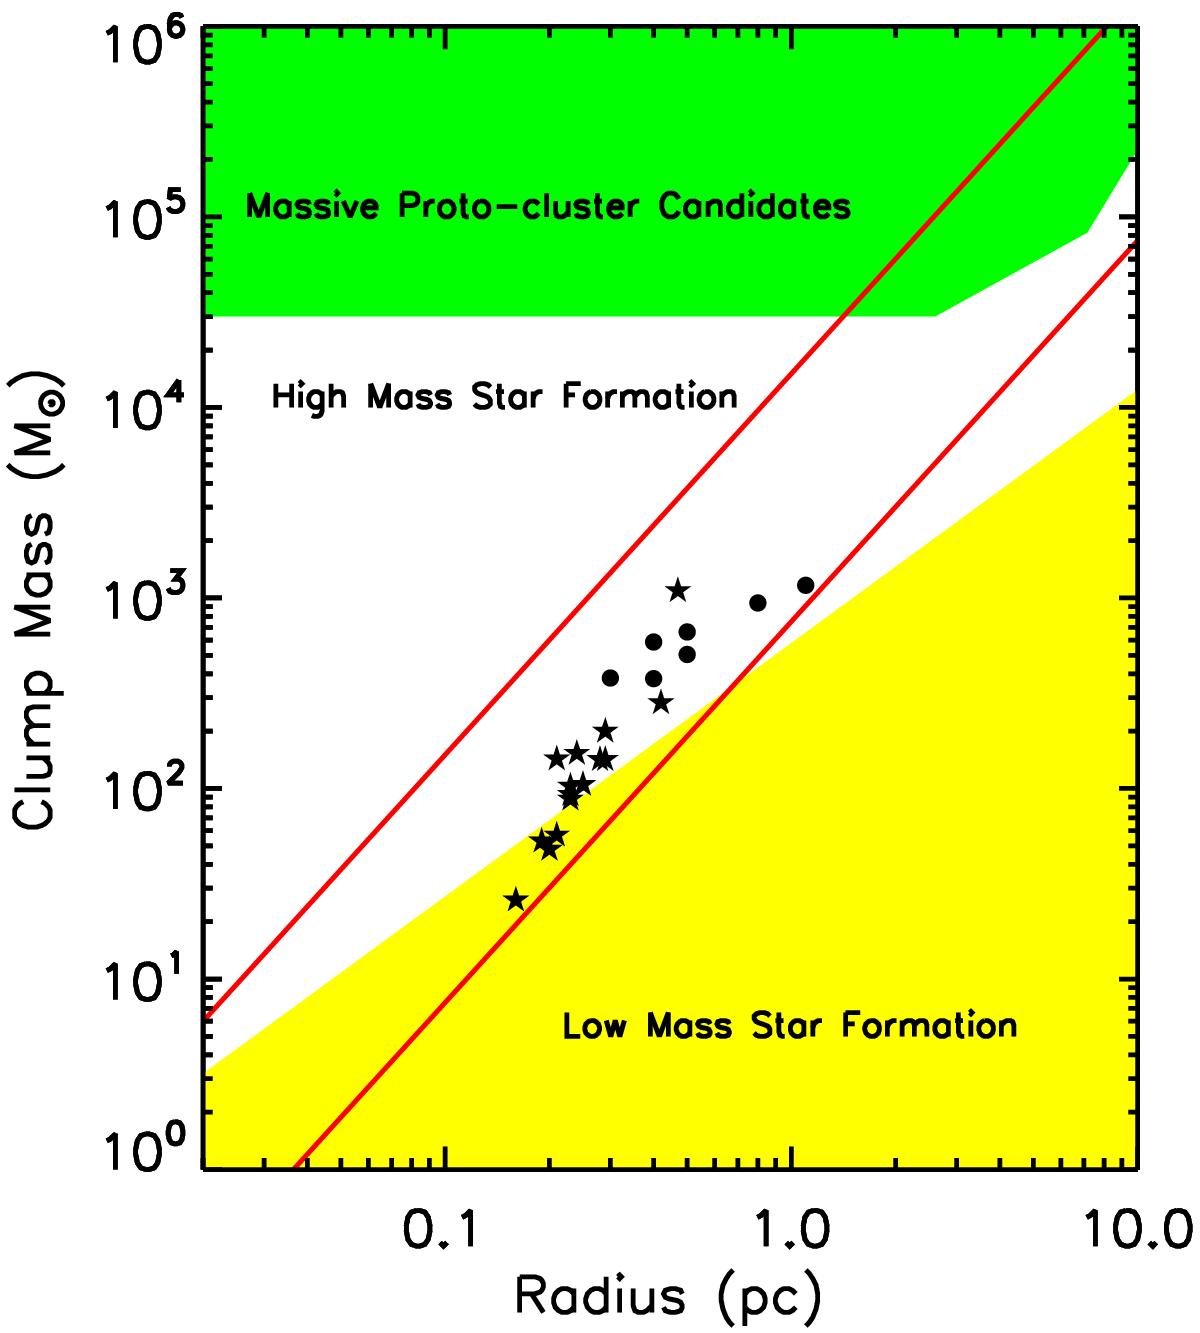
Mass-size relationship of the clumps, modified from Fig. 15 of Urquhart et al. (2013). The upper and lower red lines represent surface densities of 1 g cm-2 (Krumholz & McKee 2008) and 0.05 g cm-2 (Urquhart et al. 2013), which are empirical upper and lower bounds for the clump surface densities required for massive star formation. The yellow shaded region demonstrates the clouds without high-mass star formation, according to the empirical relationship by Kauffmann et al. (2010). The green shaded region represents the parameter space where young massive cluster progenitors are expected (e.g., Bressert et al. 2012). The circles and pentagrams represent the C18O clumps and the dust clumps, respectively.
Current usage metrics show cumulative count of Article Views (full-text article views including HTML views, PDF and ePub downloads, according to the available data) and Abstracts Views on Vision4Press platform.
Data correspond to usage on the plateform after 2015. The current usage metrics is available 48-96 hours after online publication and is updated daily on week days.
Initial download of the metrics may take a while.