Free Access
Fig. 13
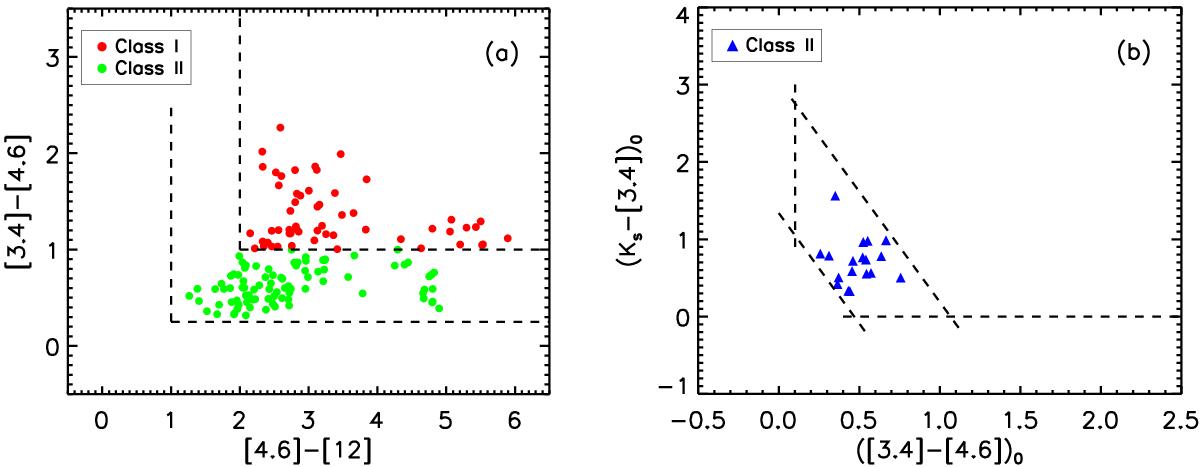
a) WISE [3.4]−[4.6] vs. [4.6]−[12] color–color diagram showing the distribution of Class I (red circles) and Class II YSOs (green circles) selected with method 1. b) Dereddened Ks −[3.4], [3.4]−[4.6] color diagram. Only 18 additional Class II YSOs (blue triangles) are selected with method 2.
This figure is made of several images, please see below:
Current usage metrics show cumulative count of Article Views (full-text article views including HTML views, PDF and ePub downloads, according to the available data) and Abstracts Views on Vision4Press platform.
Data correspond to usage on the plateform after 2015. The current usage metrics is available 48-96 hours after online publication and is updated daily on week days.
Initial download of the metrics may take a while.