Fig. B.1
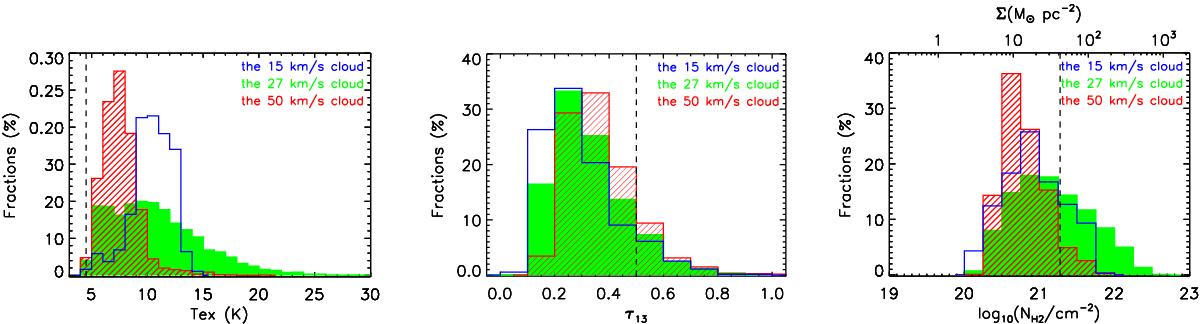
Statistics of the excitation temperature (left), 13CO (1–0) opacity (middle), H2 column density and surface density derived from 13CO (1–0) and labeled at the bottom and the top side (right) for the three molecular clouds: the 15 km s-1 cloud (open blue histogram), the 27 km s-1 cloud (filled green histogram), and the 50 km s-1 cloud (line-filled red histogram). In the left panel, the black dashed line marks Tex = 4.5 K, which corresponds to a 12CO (1–0) peak temperature of 1.5 K (~3σ, see Sect. 2). In the middle panel, the black dashed line marks τ13 = 0.5. In the right panel, the black dashed line represents the median mass surface density of molecular clouds in the Galactic Ring Survey (Heyer et al. 2009).
Current usage metrics show cumulative count of Article Views (full-text article views including HTML views, PDF and ePub downloads, according to the available data) and Abstracts Views on Vision4Press platform.
Data correspond to usage on the plateform after 2015. The current usage metrics is available 48-96 hours after online publication and is updated daily on week days.
Initial download of the metrics may take a while.