Fig. B.2
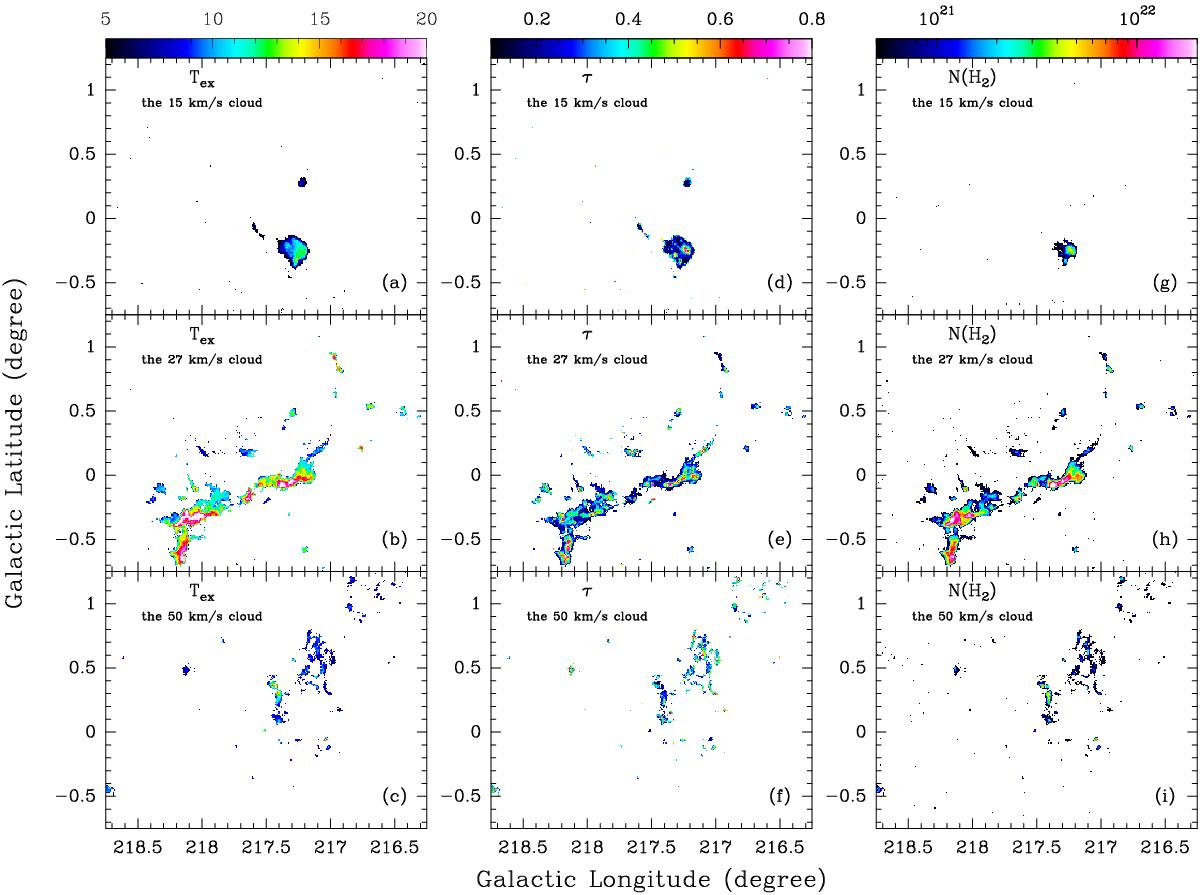
Distribution of the excitation temperature derived from 12CO (1–0) (first column), 13CO (1–0) opacity (second column), H2 column density (third column) derived from 13CO (1–0) of the three clouds. Corresponding molecular clouds and physical properties are given in the upper left corner of each panel. The color bar of the first column represents the excitation temperature in units of K. The color bar of the second column represents the 13CO (1–0) opacity. The color bar of the third column represents the H2 column density in units of cm-2.
Current usage metrics show cumulative count of Article Views (full-text article views including HTML views, PDF and ePub downloads, according to the available data) and Abstracts Views on Vision4Press platform.
Data correspond to usage on the plateform after 2015. The current usage metrics is available 48-96 hours after online publication and is updated daily on week days.
Initial download of the metrics may take a while.