Fig. 2
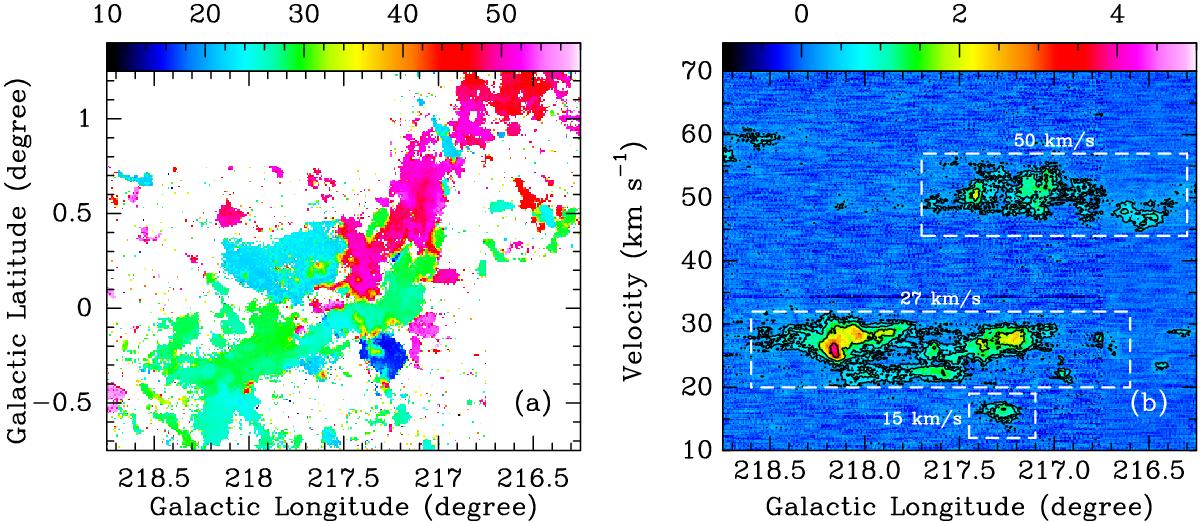
a)12CO (1–0) intensity-weighted velocity map. The color bar represents the velocity in units of km s-1. b) The position-velocity diagram of the 12CO emission averaged over the observed range in latitude and plotted against its longitude. The color bar represents intensities in units of K. The lowest contour is 0.4 K, and each contour is twice the previous one. The clouds are also marked in this panel.
Current usage metrics show cumulative count of Article Views (full-text article views including HTML views, PDF and ePub downloads, according to the available data) and Abstracts Views on Vision4Press platform.
Data correspond to usage on the plateform after 2015. The current usage metrics is available 48-96 hours after online publication and is updated daily on week days.
Initial download of the metrics may take a while.