Fig. 3
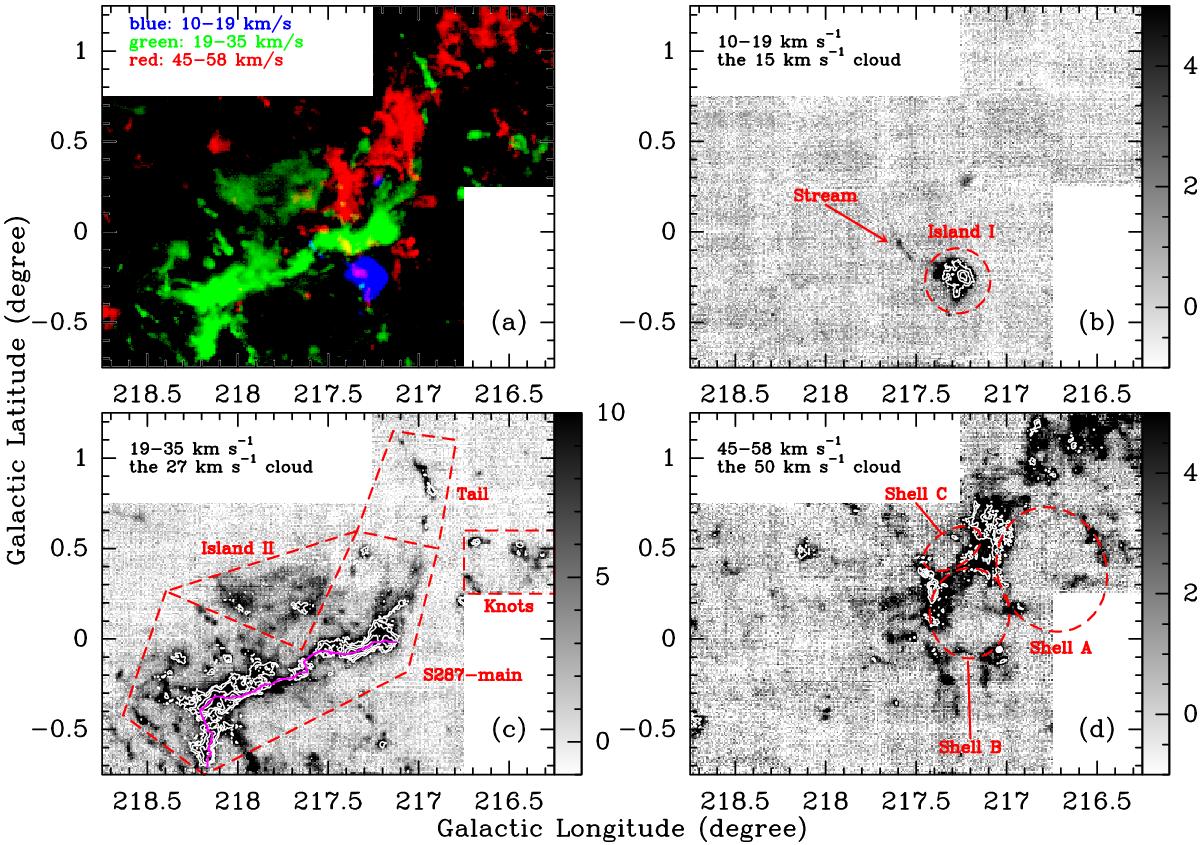
a) Three-color integrated intensity 12CO (1–0) image of the surveyed region (red: integrated between 45 and 58 km s-1; green: integrated between 19 and 35 km s-1; blue: integrated between 10 and 19 km s-1). b) 12CO (1–0) integrated intensity map (background) overlaid with a 13CO (1–0) integrated intensity map (contours). The two integrated velocity ranges extend from 10 to 19 km s-1. The grayscale colors correspond to a linear stretch of 12CO (1–0) integrated intensities in units of K km s-1. The contours represent 13CO (1–0) integrated intensities that start at 1.5 K km s-1 and increase by 2.5 km s-1. c) Same as Fig. 3b, but integrated velocity ranges extend from 19 to 35 km s-1. The contours start at 2.0 K km s-1 , and each contour is twice the previous one. The purple solid line marks the highest H2 column density line of the filament S287-main along its long axis. d) Same as Fig. 3b, but integrated velocity ranges reach from 45 to 58 km s-1. The contours start at 1.8 K km s-1 and increase by 1.8 K km s-1. The subregions of the three clouds are marked and labeled in the respective panels.
Current usage metrics show cumulative count of Article Views (full-text article views including HTML views, PDF and ePub downloads, according to the available data) and Abstracts Views on Vision4Press platform.
Data correspond to usage on the plateform after 2015. The current usage metrics is available 48-96 hours after online publication and is updated daily on week days.
Initial download of the metrics may take a while.