Fig. 5
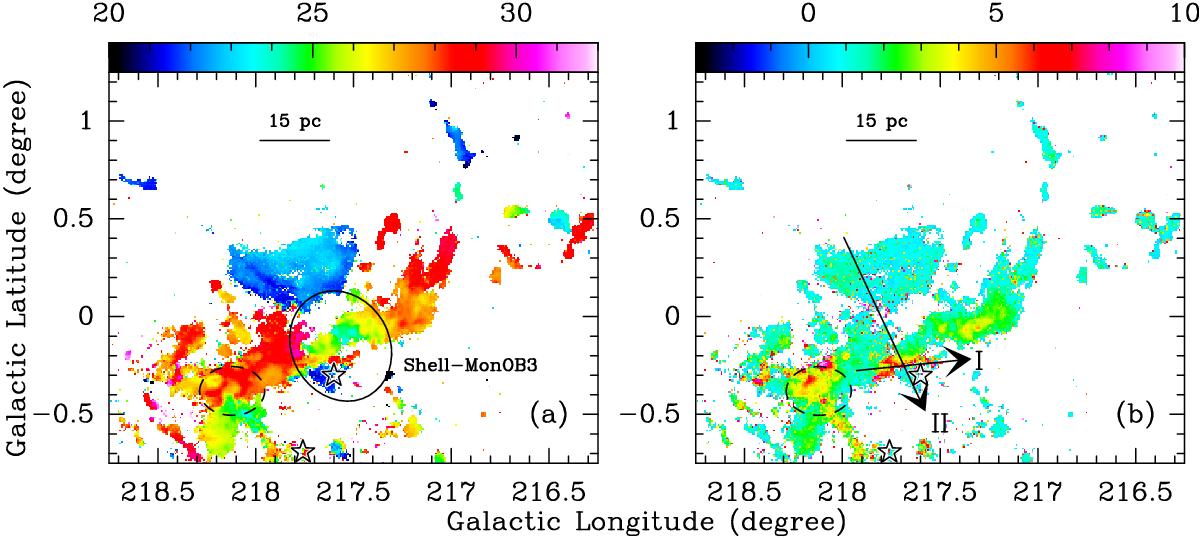
a)12CO (1–0) intensity-weighted velocity map toward the 27 km s-1 cloud. The color bar represents velocities in units of km s-1. The HII region S287, the stellar association Mon OB3, and the open cluster NGC 2311 are marked with a black dashed ellipse and open pentagrams. The solid black ellipse marks the cavity-like feature. b) Same as Fig. 5a but for the intensity-weighted 12CO (1–0) line width map of the 27 km s-1 cloud. The arrows represent the p-v cuts of the interacting interface I and II, indicated by I and II in the panel. Their corresponding position-velocity maps are shown in Fig. 7.
Current usage metrics show cumulative count of Article Views (full-text article views including HTML views, PDF and ePub downloads, according to the available data) and Abstracts Views on Vision4Press platform.
Data correspond to usage on the plateform after 2015. The current usage metrics is available 48-96 hours after online publication and is updated daily on week days.
Initial download of the metrics may take a while.