Fig. 3
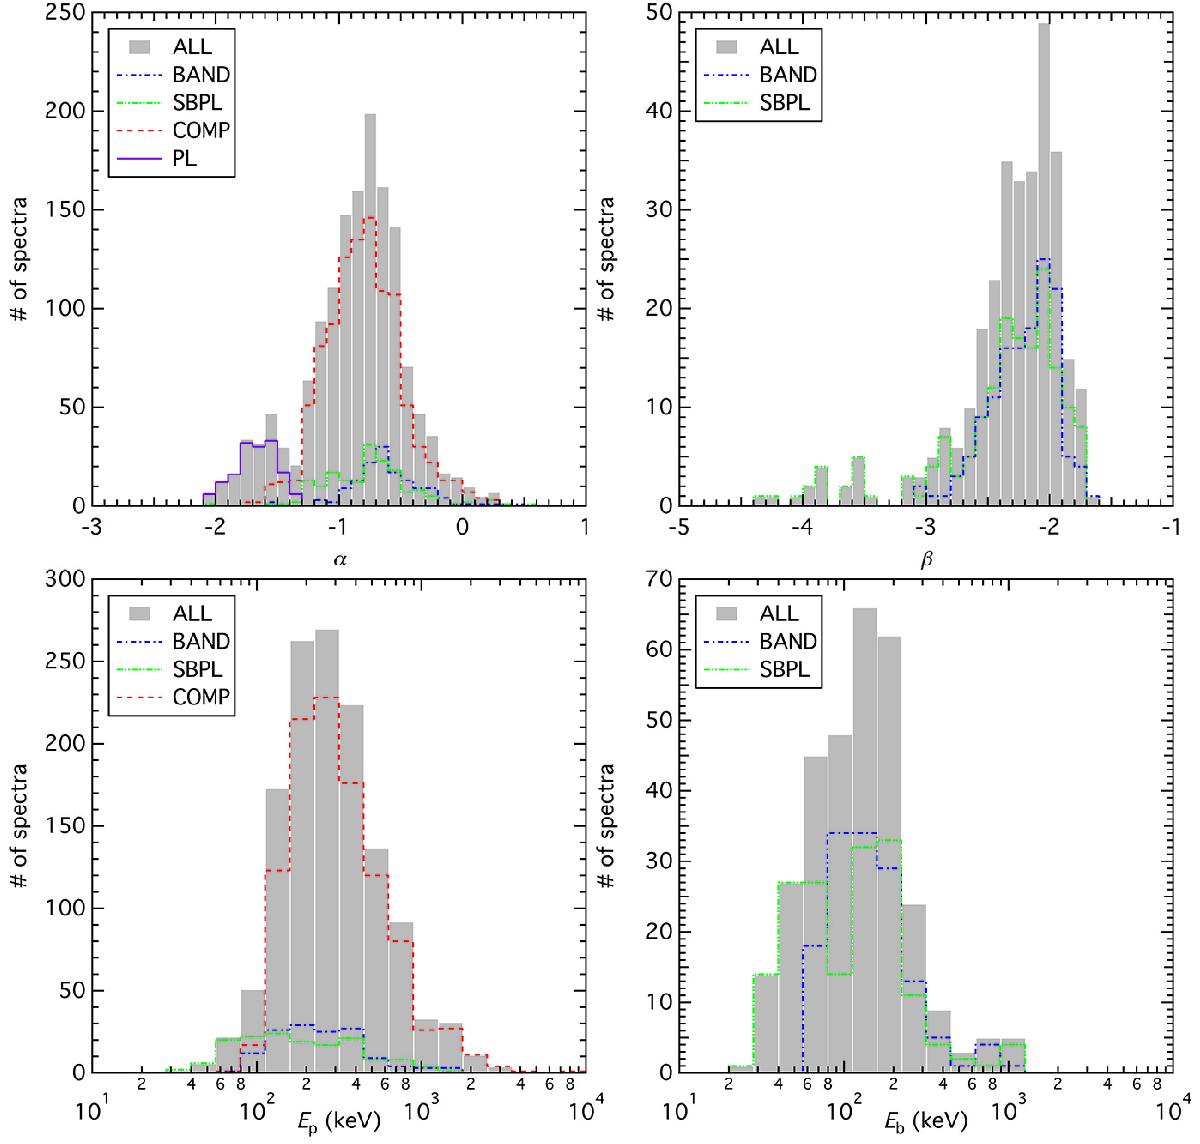
Distributions of the BEST sample spectral parameters. The BAND parameter populations are shown with blue dash-dotted lines, SBPL with green dash-double dotted lines, COMP with red dashed lines, and PL with purple solid lines. The overall populations (ALL) are shown with gray solid histograms. Top left panel: distributions of α. Top right panel: distributions of β. Bottom left panel: distributions of Ep. Bottom right panel: distributions of Eb.
Current usage metrics show cumulative count of Article Views (full-text article views including HTML views, PDF and ePub downloads, according to the available data) and Abstracts Views on Vision4Press platform.
Data correspond to usage on the plateform after 2015. The current usage metrics is available 48-96 hours after online publication and is updated daily on week days.
Initial download of the metrics may take a while.