Free Access
Fig. A.1
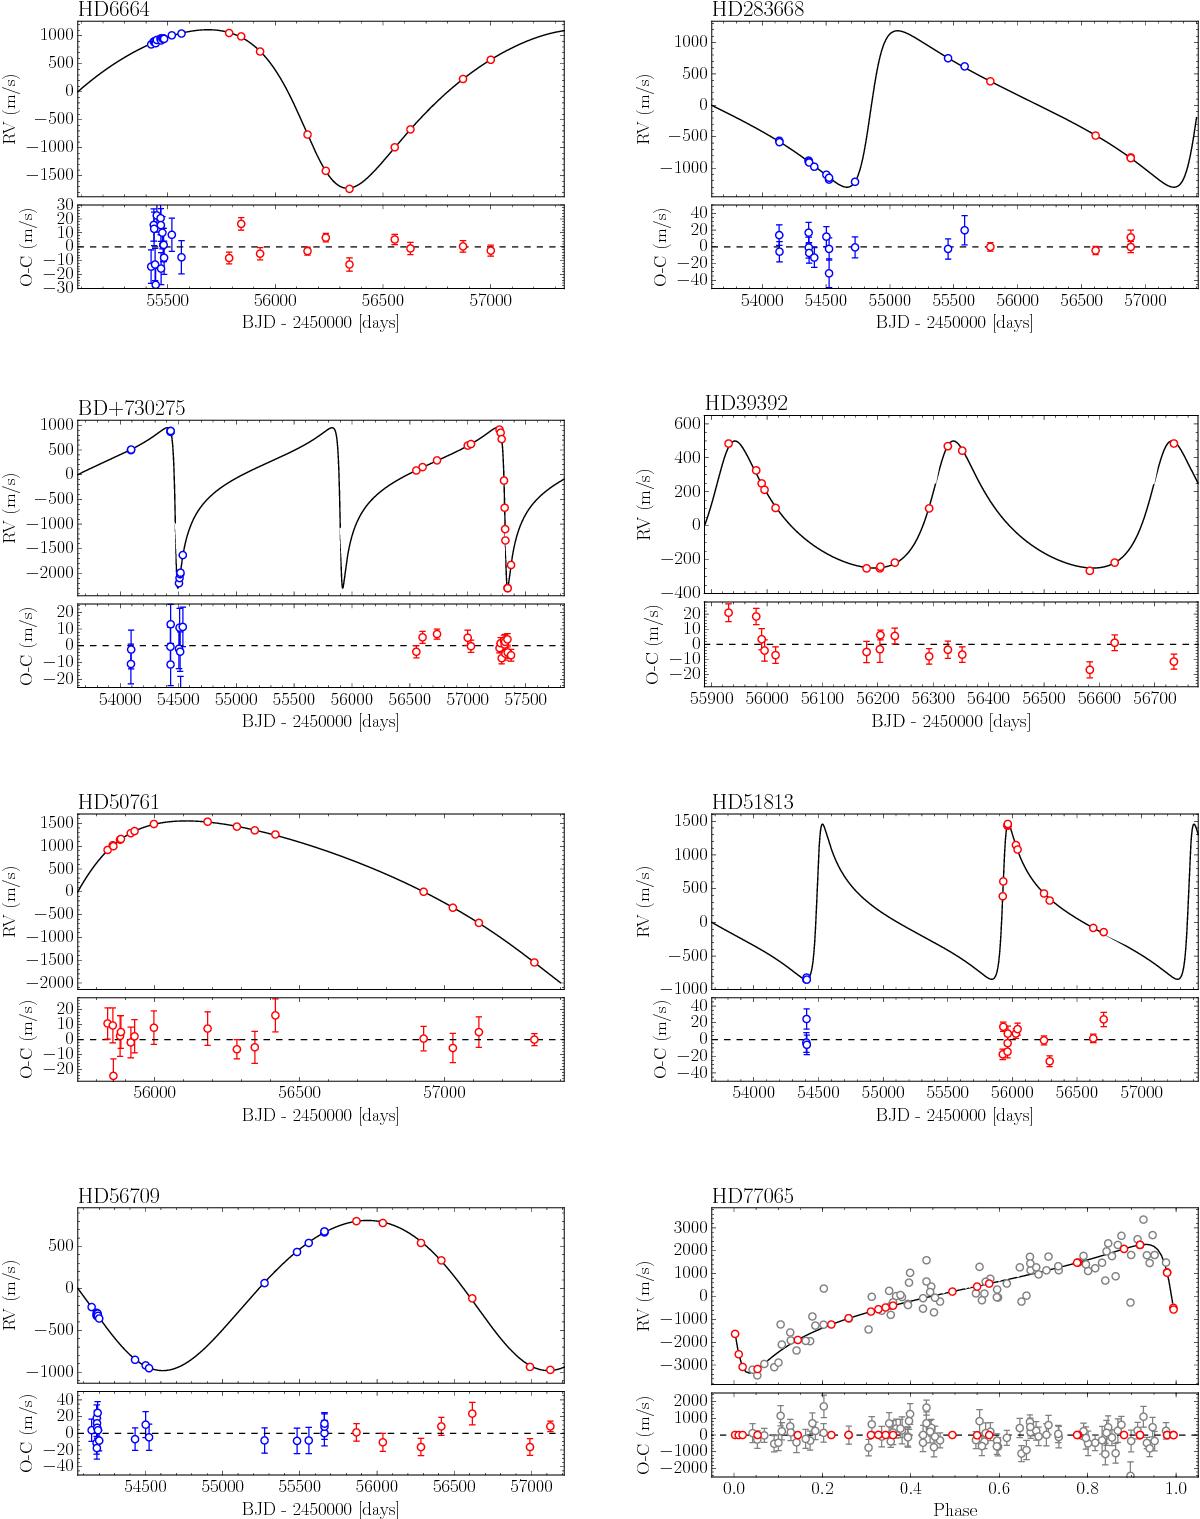
Radial velocity measurements obtained with SOPHIE. The top panel shows the best fit to the data with the bottom panel showing the best fit residuals. Blue points indicate data taken prior to the 17th of June 2011 instrument upgrade. The grey points represent data from Latham et al. (2002).
Current usage metrics show cumulative count of Article Views (full-text article views including HTML views, PDF and ePub downloads, according to the available data) and Abstracts Views on Vision4Press platform.
Data correspond to usage on the plateform after 2015. The current usage metrics is available 48-96 hours after online publication and is updated daily on week days.
Initial download of the metrics may take a while.