Fig. 3
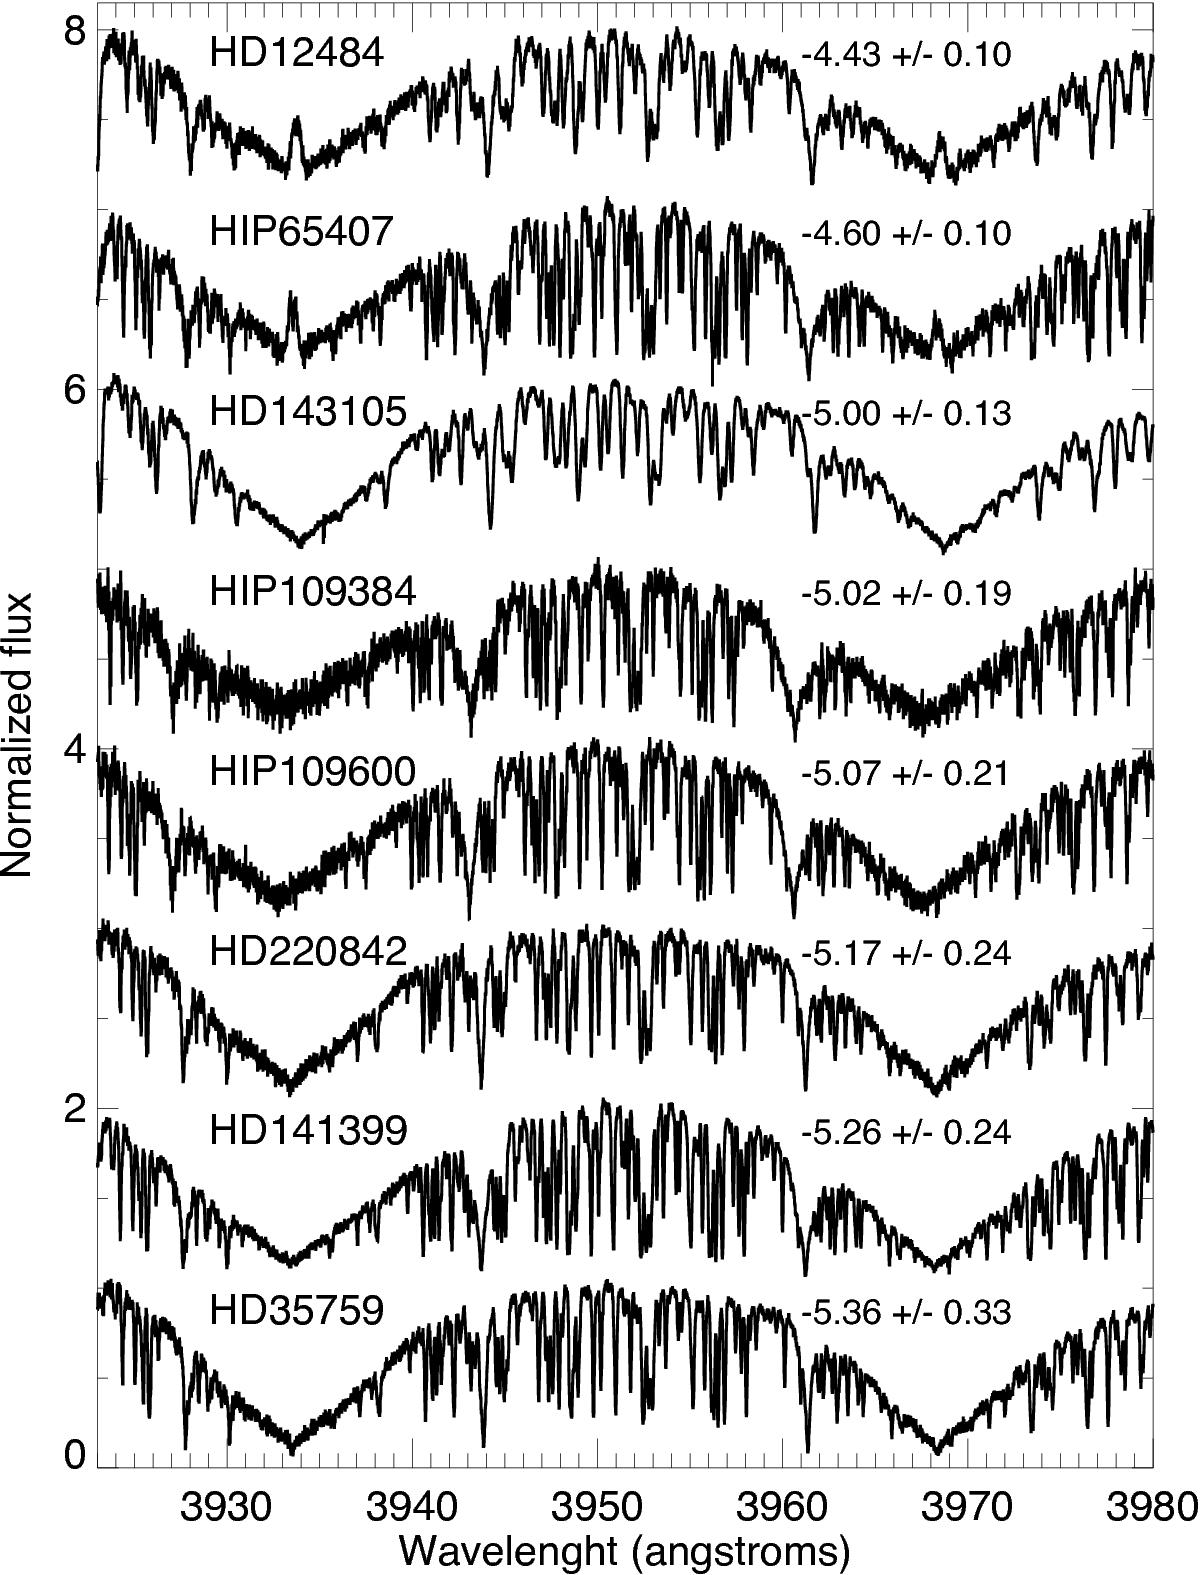
H and K Ca ii lines of the eight planet-host stars on the averaged SOPHIE spectra. The stars are sorted by increasing activity from bottom to top, with the ![]() values overplotted on the right. The flux of HD 35759 is the correct one; each star plotted above is successively shifted by 1 on the y-scale for visibility reasons. Only HD 12484 and HIP 65407 show visually significant chromospheric emissions.
values overplotted on the right. The flux of HD 35759 is the correct one; each star plotted above is successively shifted by 1 on the y-scale for visibility reasons. Only HD 12484 and HIP 65407 show visually significant chromospheric emissions.
Current usage metrics show cumulative count of Article Views (full-text article views including HTML views, PDF and ePub downloads, according to the available data) and Abstracts Views on Vision4Press platform.
Data correspond to usage on the plateform after 2015. The current usage metrics is available 48-96 hours after online publication and is updated daily on week days.
Initial download of the metrics may take a while.