Fig. 6
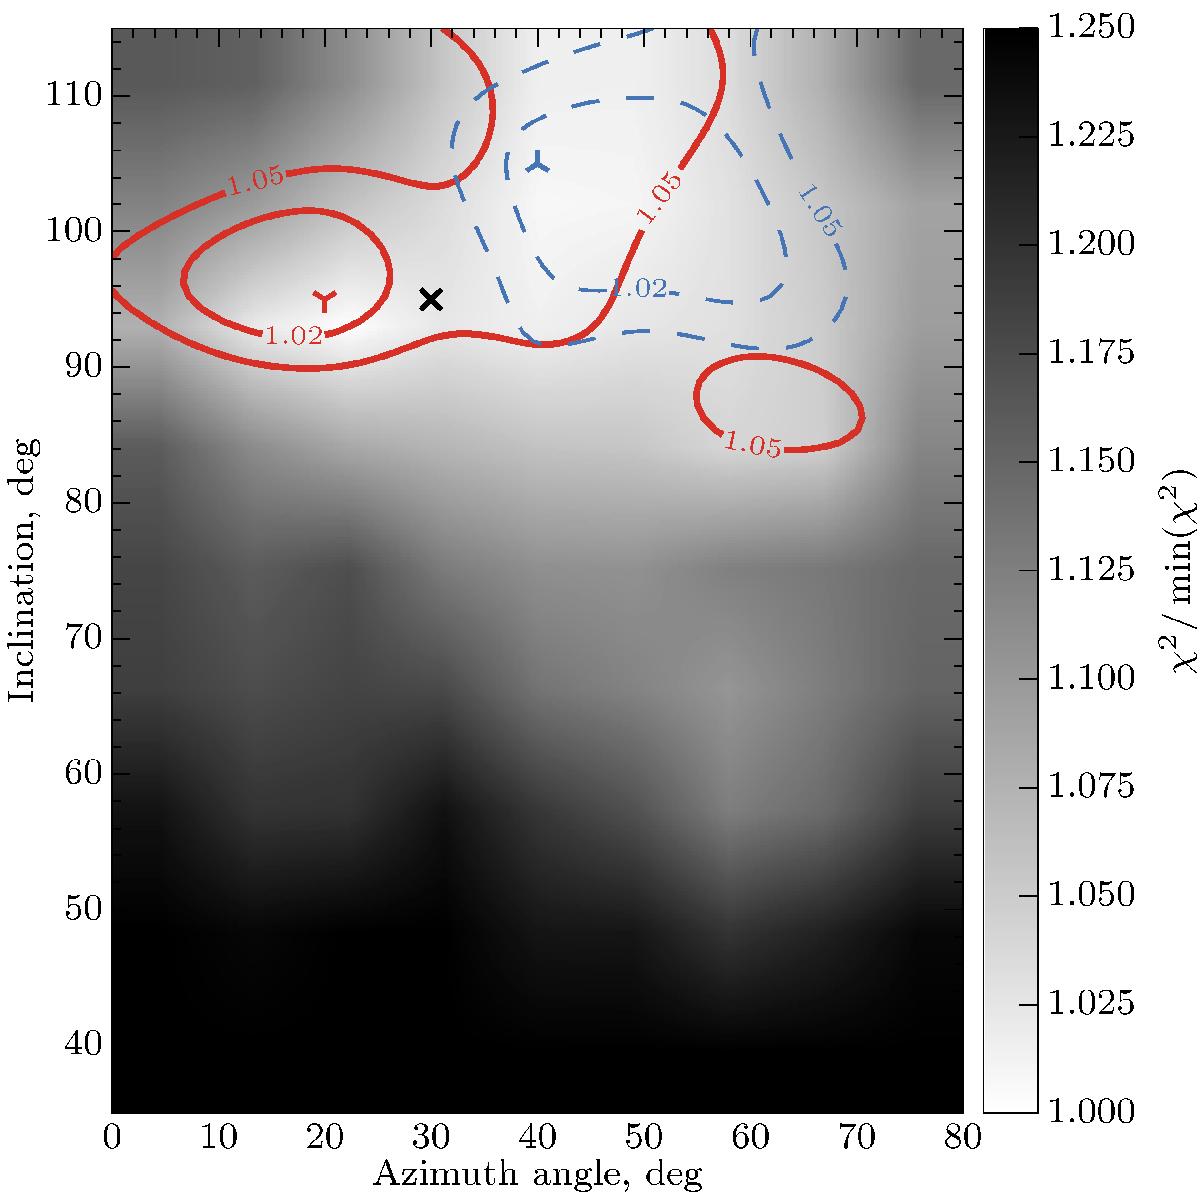
Variation of χ2 of the fit to the Stokes QU profiles with inclination i and azimuth angle Θ. The contours plotted with thick (red) lines show the 2%, and 5% increase from the minimum indicated with a ʏ symbol for the Fe and Cr lines. The contours plotted with dashed (blue) lines show the same for the rare earth lines, the minimum in this case is indicated with a ⋎ symbol. The × symbol indicates the adopted values of i and Θ.
Current usage metrics show cumulative count of Article Views (full-text article views including HTML views, PDF and ePub downloads, according to the available data) and Abstracts Views on Vision4Press platform.
Data correspond to usage on the plateform after 2015. The current usage metrics is available 48-96 hours after online publication and is updated daily on week days.
Initial download of the metrics may take a while.