Fig. 6
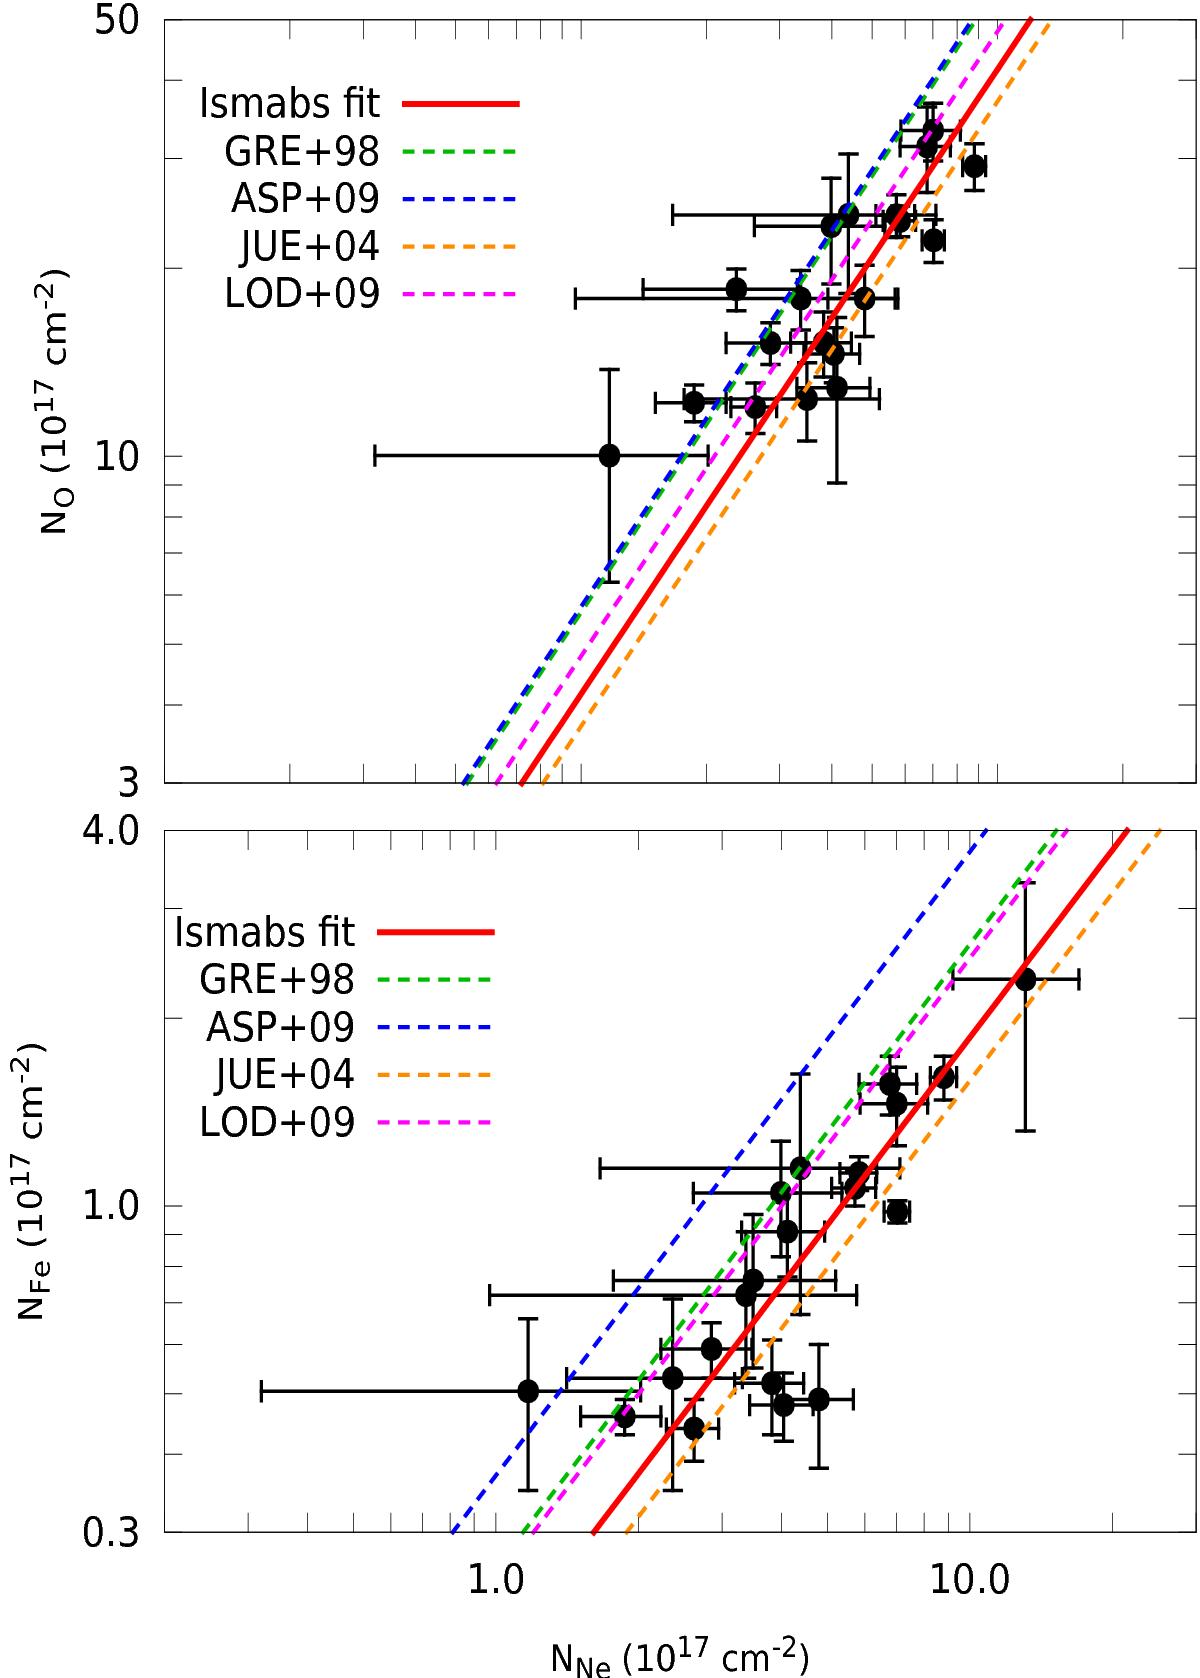
Comparison of the abundance ratios NO/NNe (top panel) and NFe/NNe (bottom panel) obtained from the broadband fit with ISMabs for all the analysed sources. The best fitted Nx/NNe ratio for all sources is plotted with a solid red line. Ratios obtained from Grevesse & Sauval (1998), Asplund et al. (2009), Lodders et al. (2009) and Juett et al. (2004) are respectively shown with green, blue, orange and magenta dashed lines.
Current usage metrics show cumulative count of Article Views (full-text article views including HTML views, PDF and ePub downloads, according to the available data) and Abstracts Views on Vision4Press platform.
Data correspond to usage on the plateform after 2015. The current usage metrics is available 48-96 hours after online publication and is updated daily on week days.
Initial download of the metrics may take a while.