Fig. 8
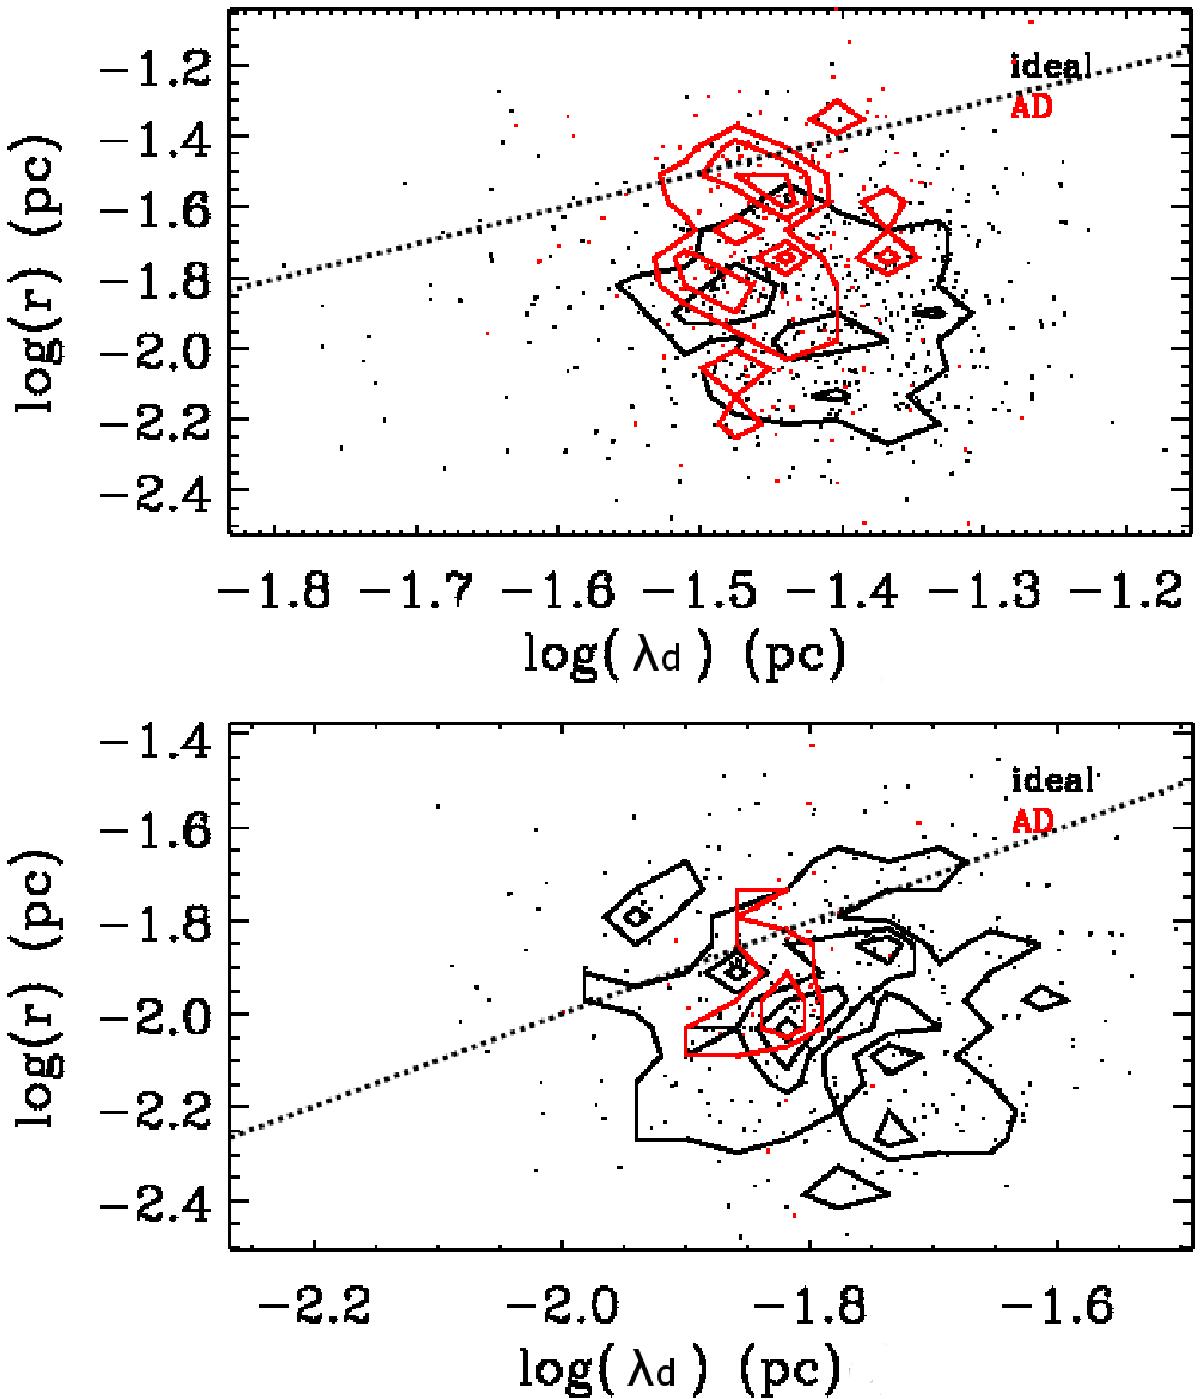
Scatter plots (dots) of the logarithm of the mean filament thickness versus the logarithm of λd in runs A0 (black) and B0 (red). The simulation time is t = 10-2. Shown here are density thresholds 2000 cm-3 (top) and 5000 cm-3 (bottom). The contours show the surface density distribution of the points and the dotted lines show the relation λd = r.
Current usage metrics show cumulative count of Article Views (full-text article views including HTML views, PDF and ePub downloads, according to the available data) and Abstracts Views on Vision4Press platform.
Data correspond to usage on the plateform after 2015. The current usage metrics is available 48-96 hours after online publication and is updated daily on week days.
Initial download of the metrics may take a while.