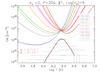
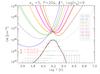
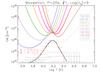
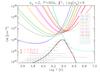
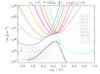
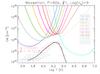
Fig. 6
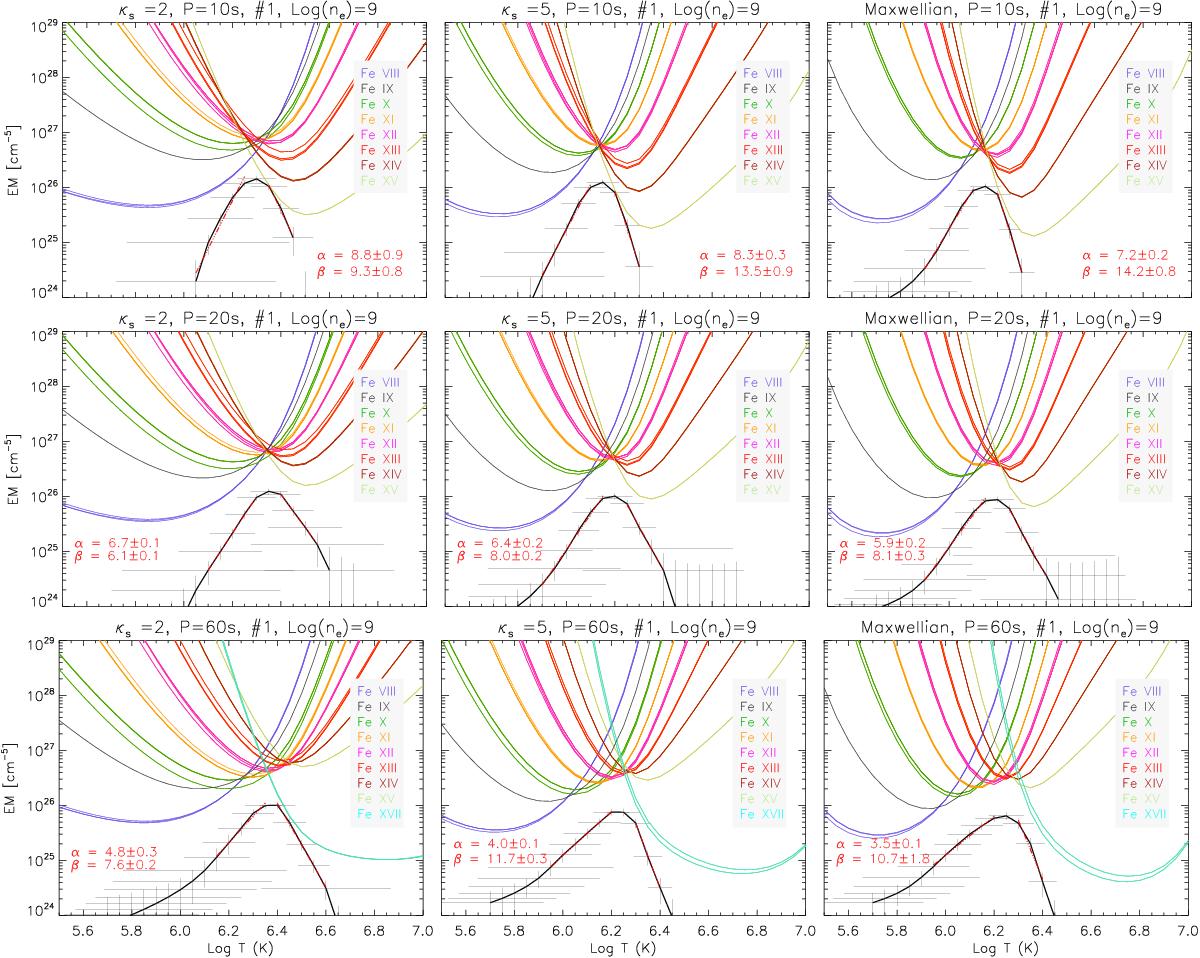
Emission measure distributions EM(T) derived under the assumption of a constant κs using the intensities averaged over the first period for P = 10 s (top), 20 s (middle), and 60 s (bottom). The spectra correspond to log(ne [cm-3]) = 9. Low-T and high-T power-law slopes of the EM(T) functions are denoted α and β, respectively.
Current usage metrics show cumulative count of Article Views (full-text article views including HTML views, PDF and ePub downloads, according to the available data) and Abstracts Views on Vision4Press platform.
Data correspond to usage on the plateform after 2015. The current usage metrics is available 48-96 hours after online publication and is updated daily on week days.
Initial download of the metrics may take a while.