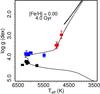
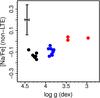
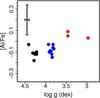
Fig. 3
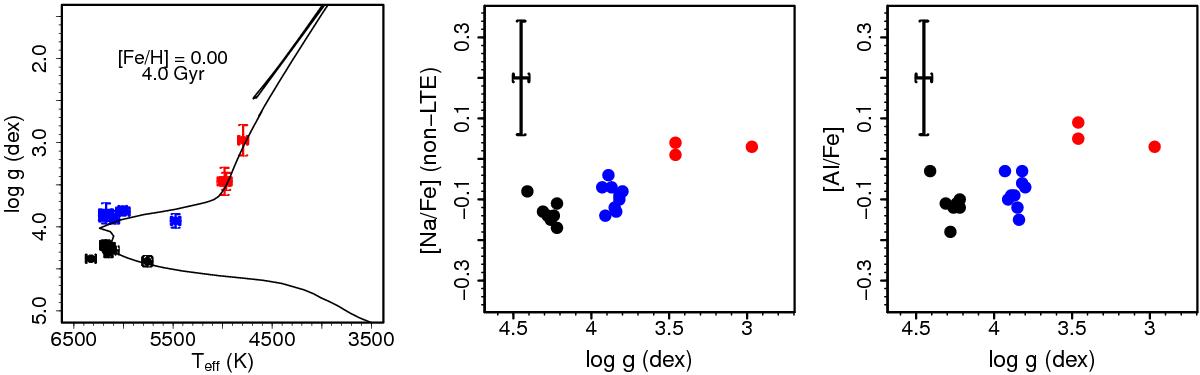
Left panel: sample stars from M 67 in the Teff–log g plane. Middle panel: [Na/Fe] ratio of each star in M 67 as a function of its surface gravity. Right panel: [Al/Fe] ratio of each star in M 67 as a function of its surface gravity. Stars are color-coded according to the surface gravity: red for giants with log g ≤ 3.5, blue for turn-off and subgiant stars with 3.5 < log g ≤ 4.0, and black for main-sequence stars with log g> 4.0. A typical error bar (±0.14 dex for [Elem./Fe] and ±0.05 dex for log g) is shown in the upper left part of the middle and right panels.
Current usage metrics show cumulative count of Article Views (full-text article views including HTML views, PDF and ePub downloads, according to the available data) and Abstracts Views on Vision4Press platform.
Data correspond to usage on the plateform after 2015. The current usage metrics is available 48-96 hours after online publication and is updated daily on week days.
Initial download of the metrics may take a while.