Fig. 5
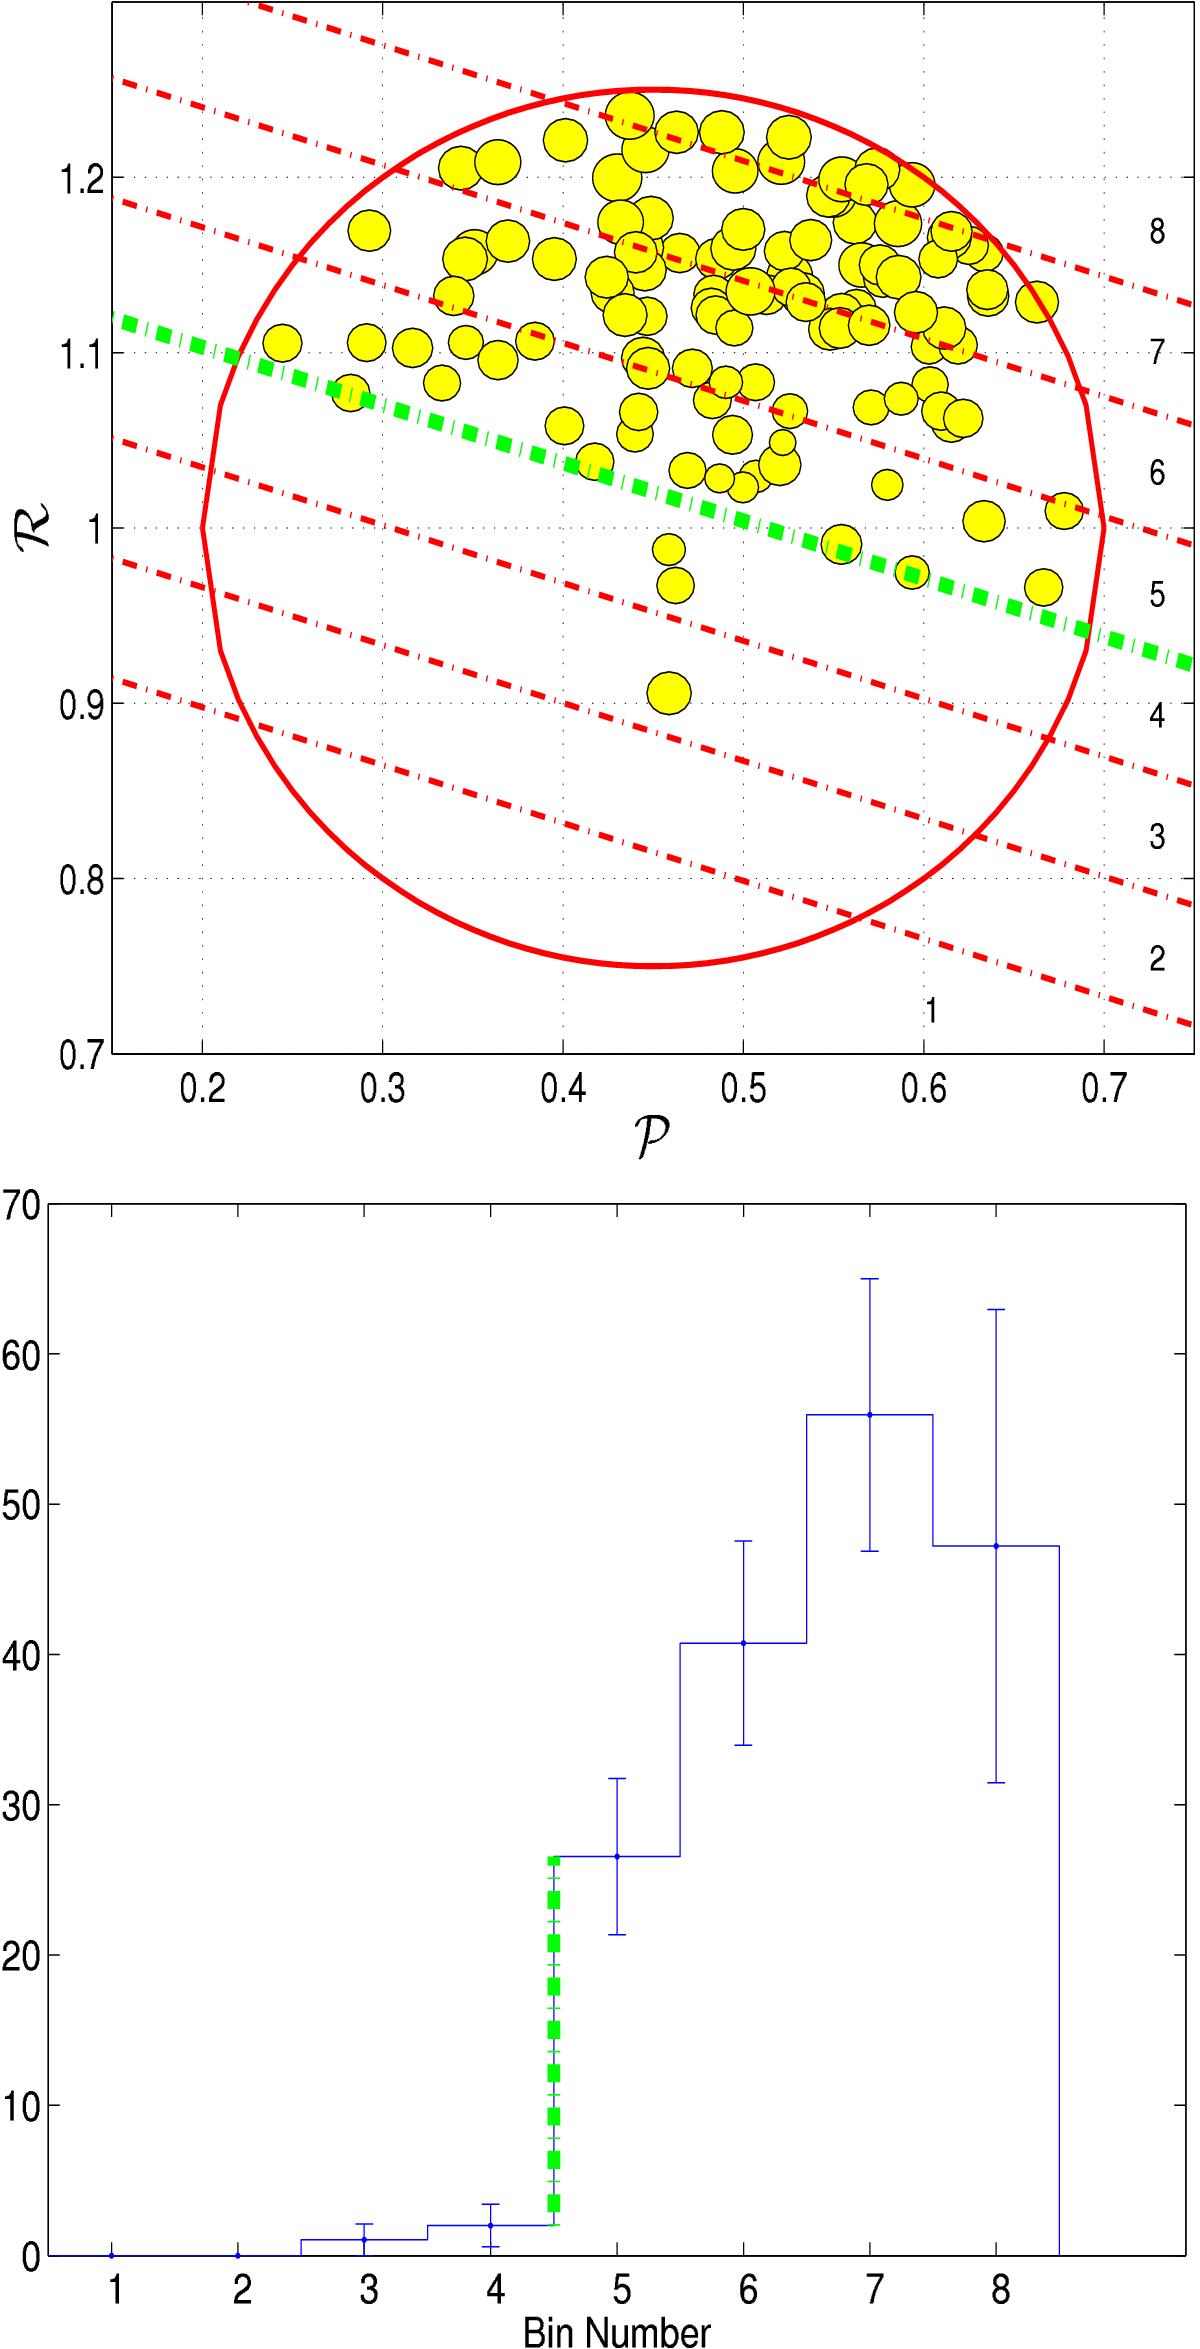
Stripe technique for deriving the upper boundary of the period-radius desert. Only ground-based detections were used. Upper panel: the circle in which the analysis was performed, as in Fig. 2, divided this time into eight numbered stripes. The slope of the stripes shown yielded the highest contrast. Lower panel: histogram plot of the number of planets in each stripe, normalized to its area inside the circle.

Current usage metrics show cumulative count of Article Views (full-text article views including HTML views, PDF and ePub downloads, according to the available data) and Abstracts Views on Vision4Press platform.
Data correspond to usage on the plateform after 2015. The current usage metrics is available 48-96 hours after online publication and is updated daily on week days.
Initial download of the metrics may take a while.