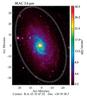
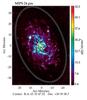
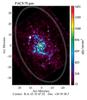
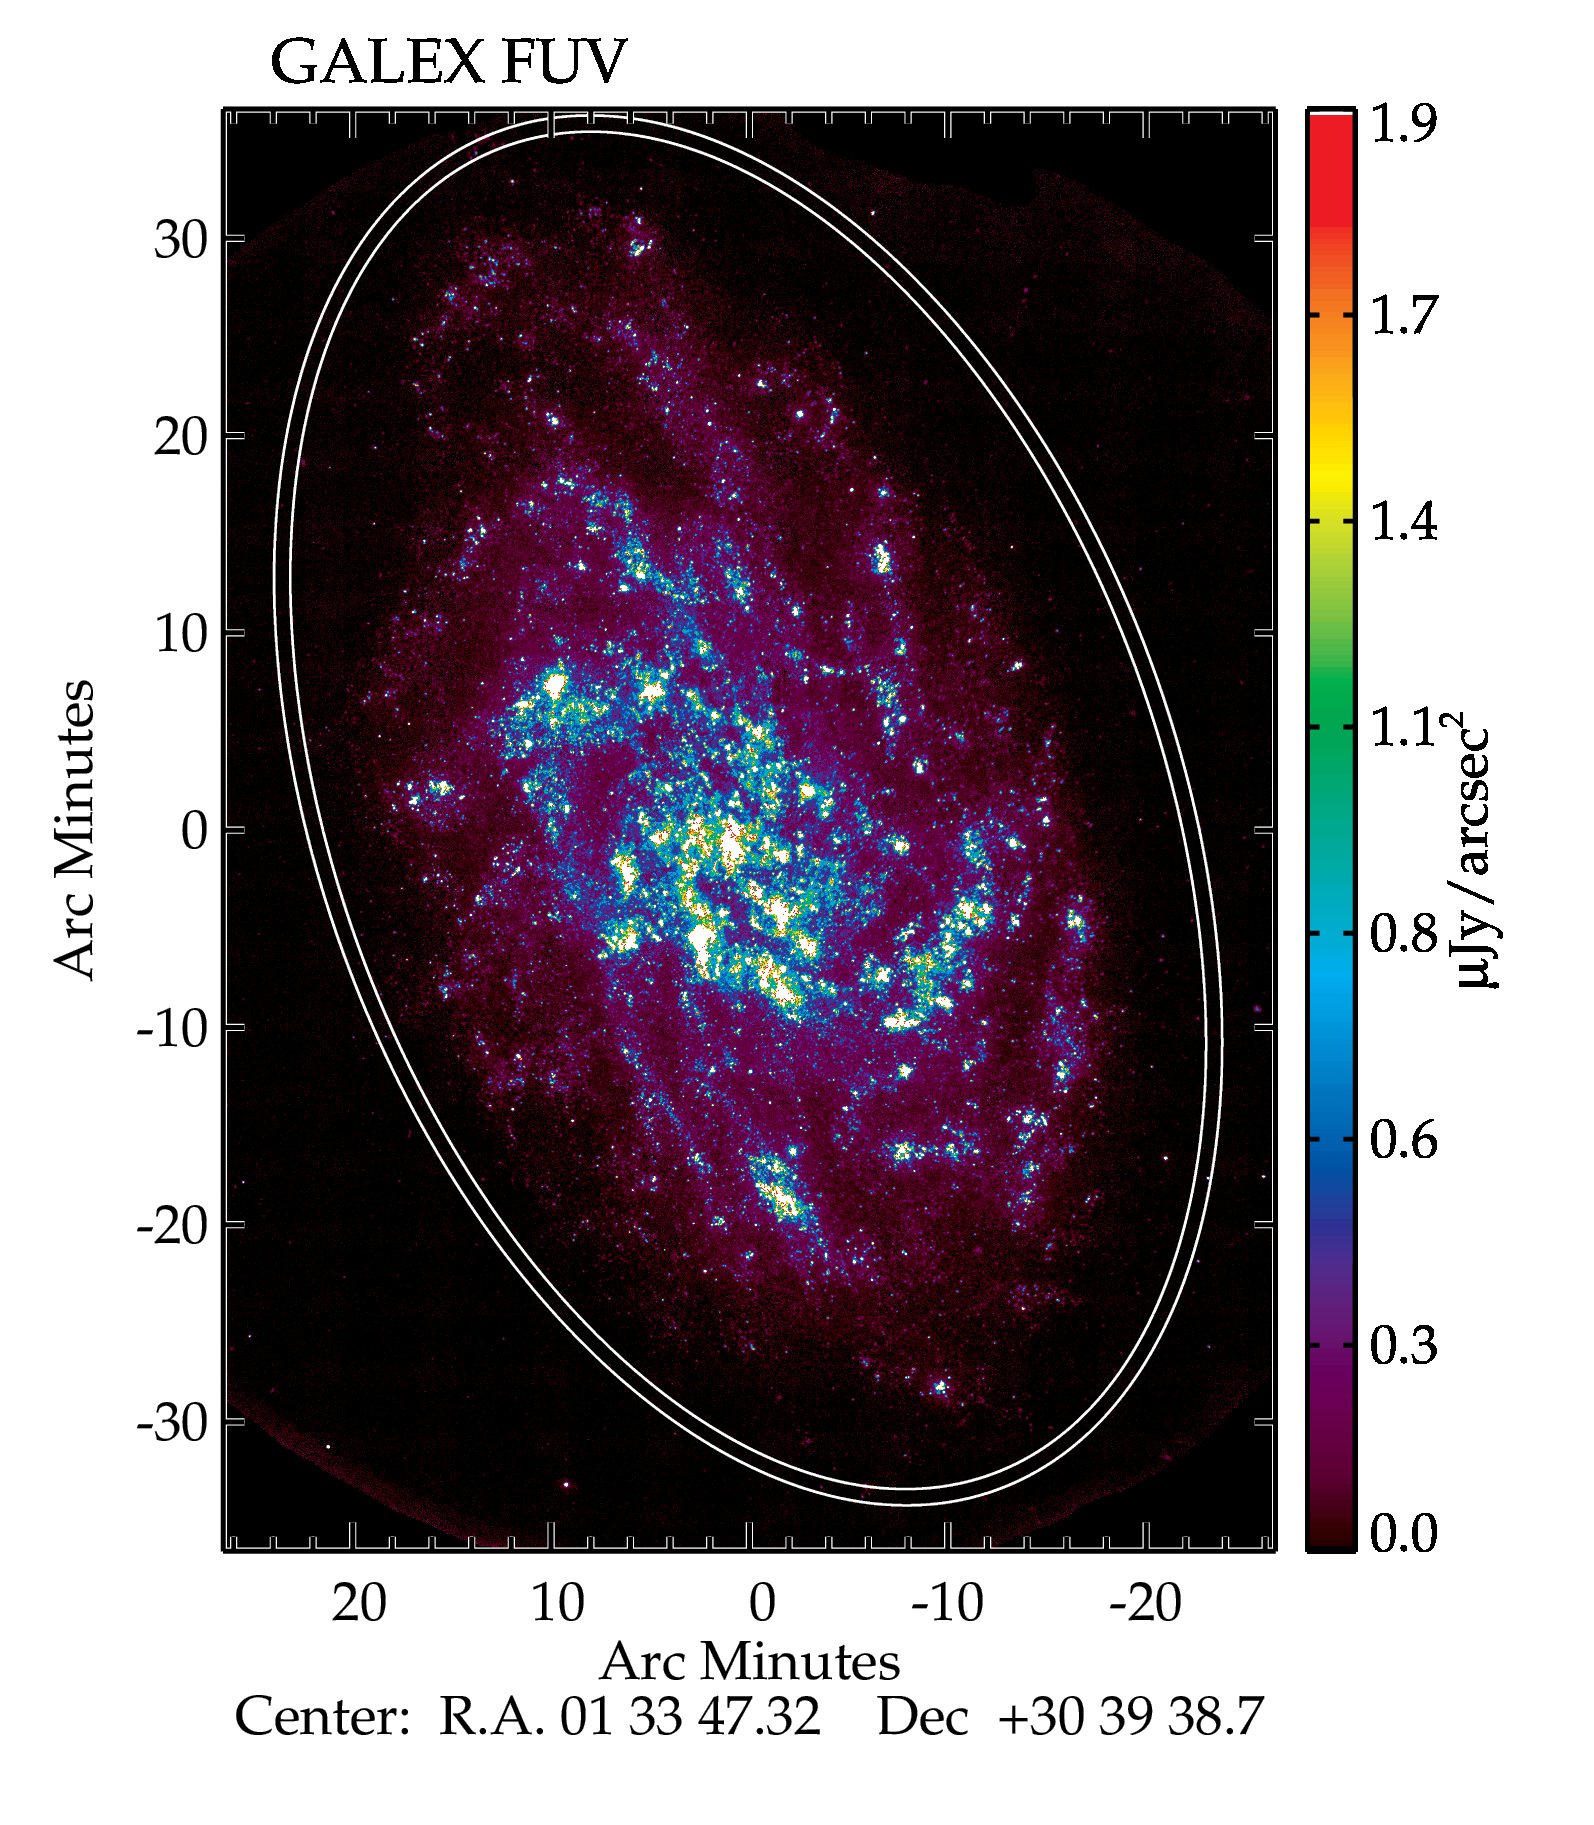
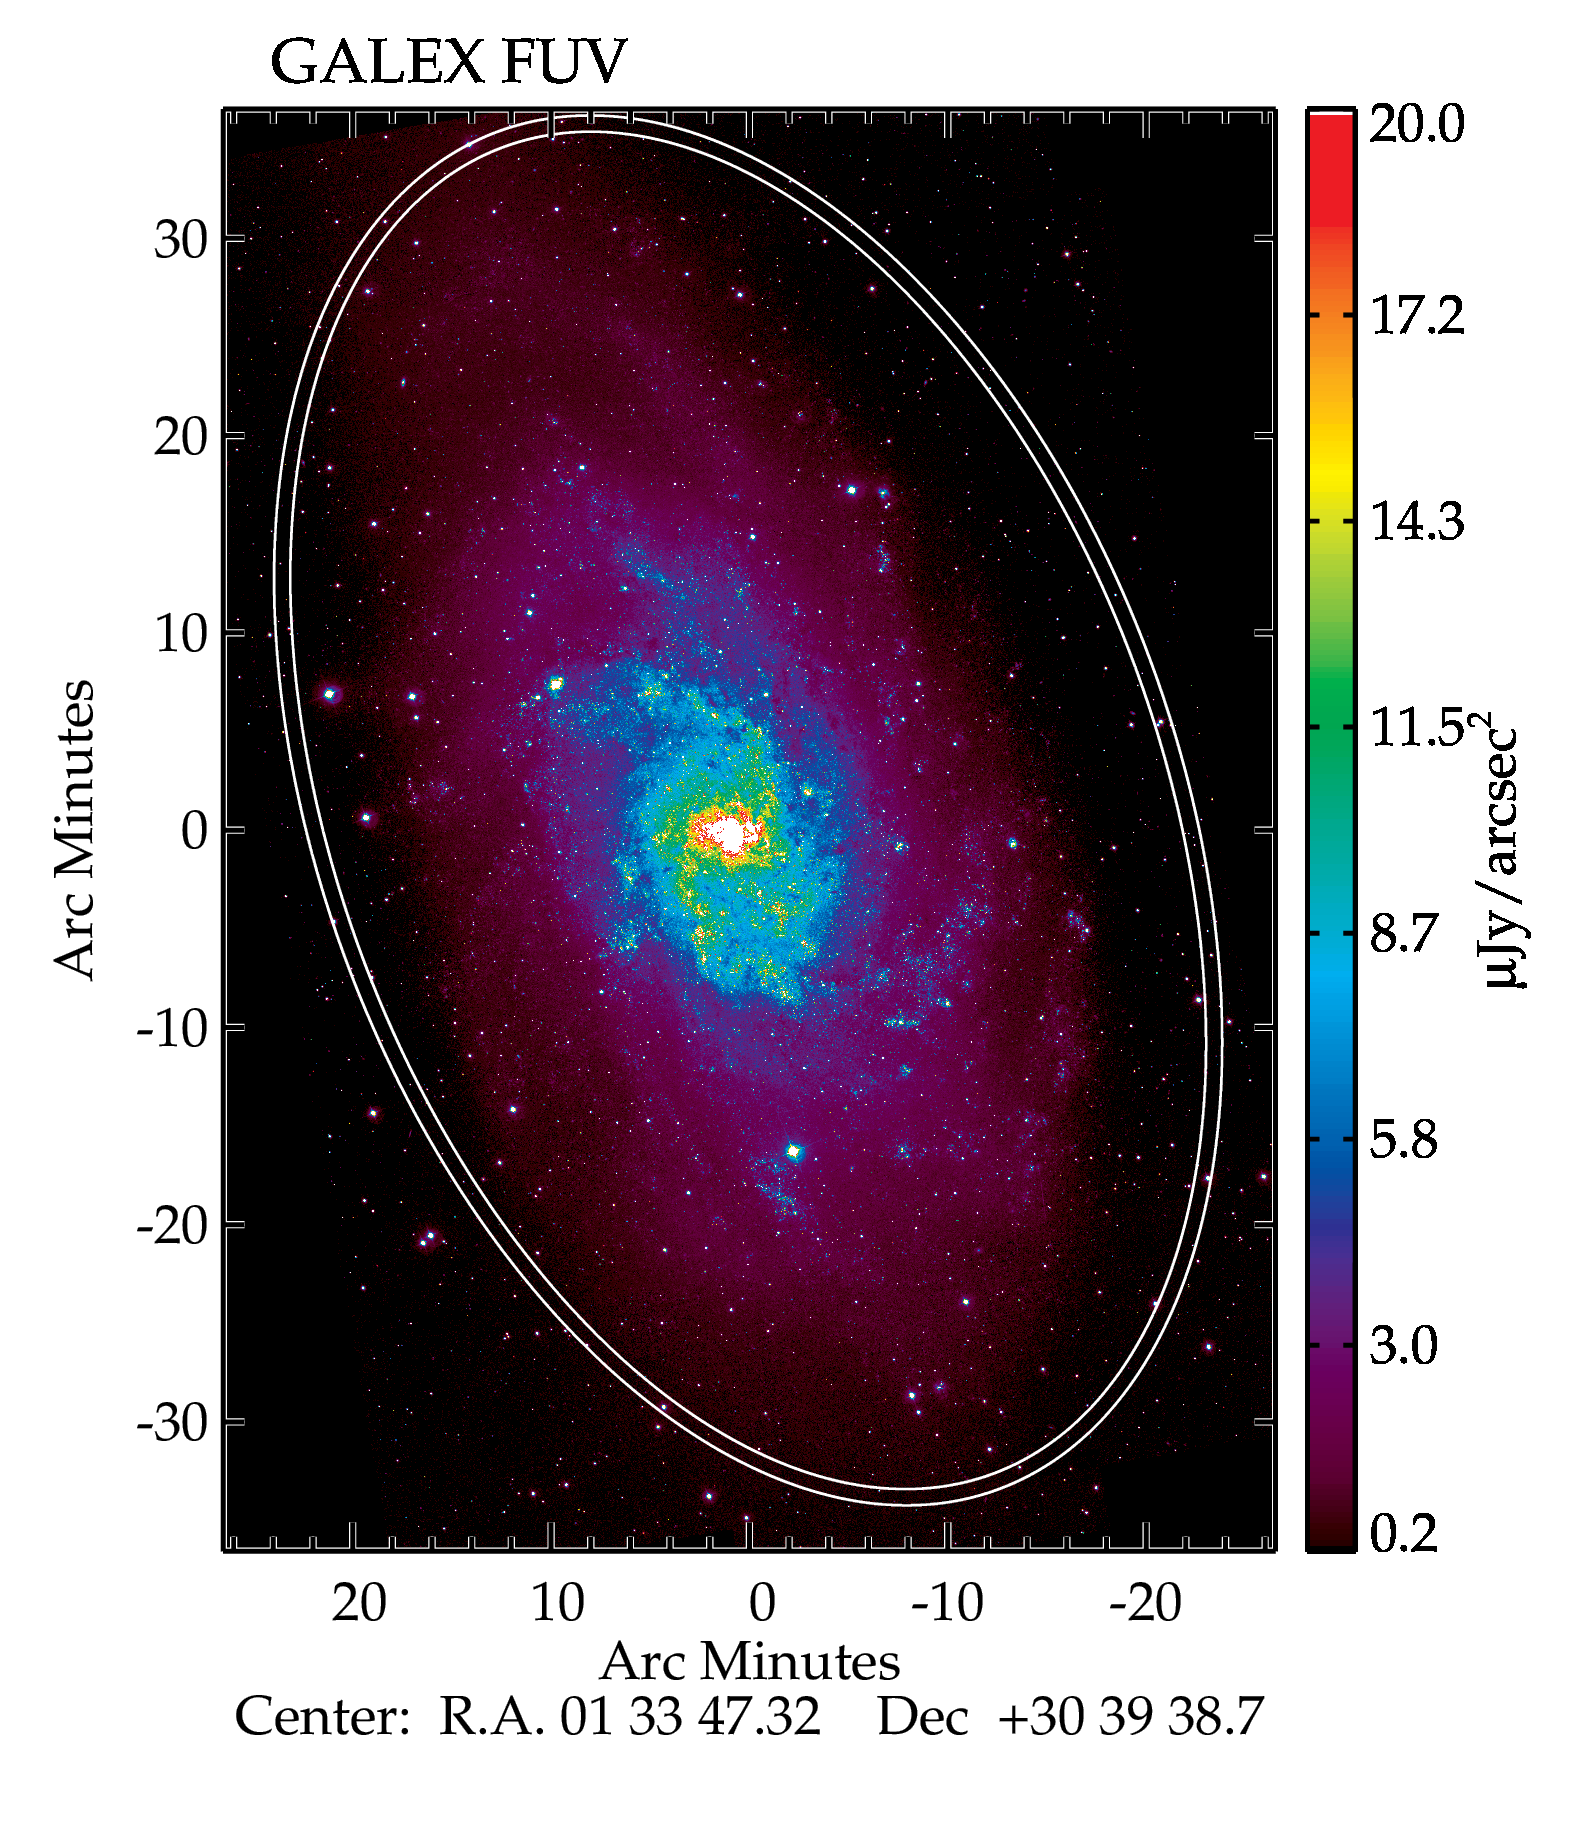
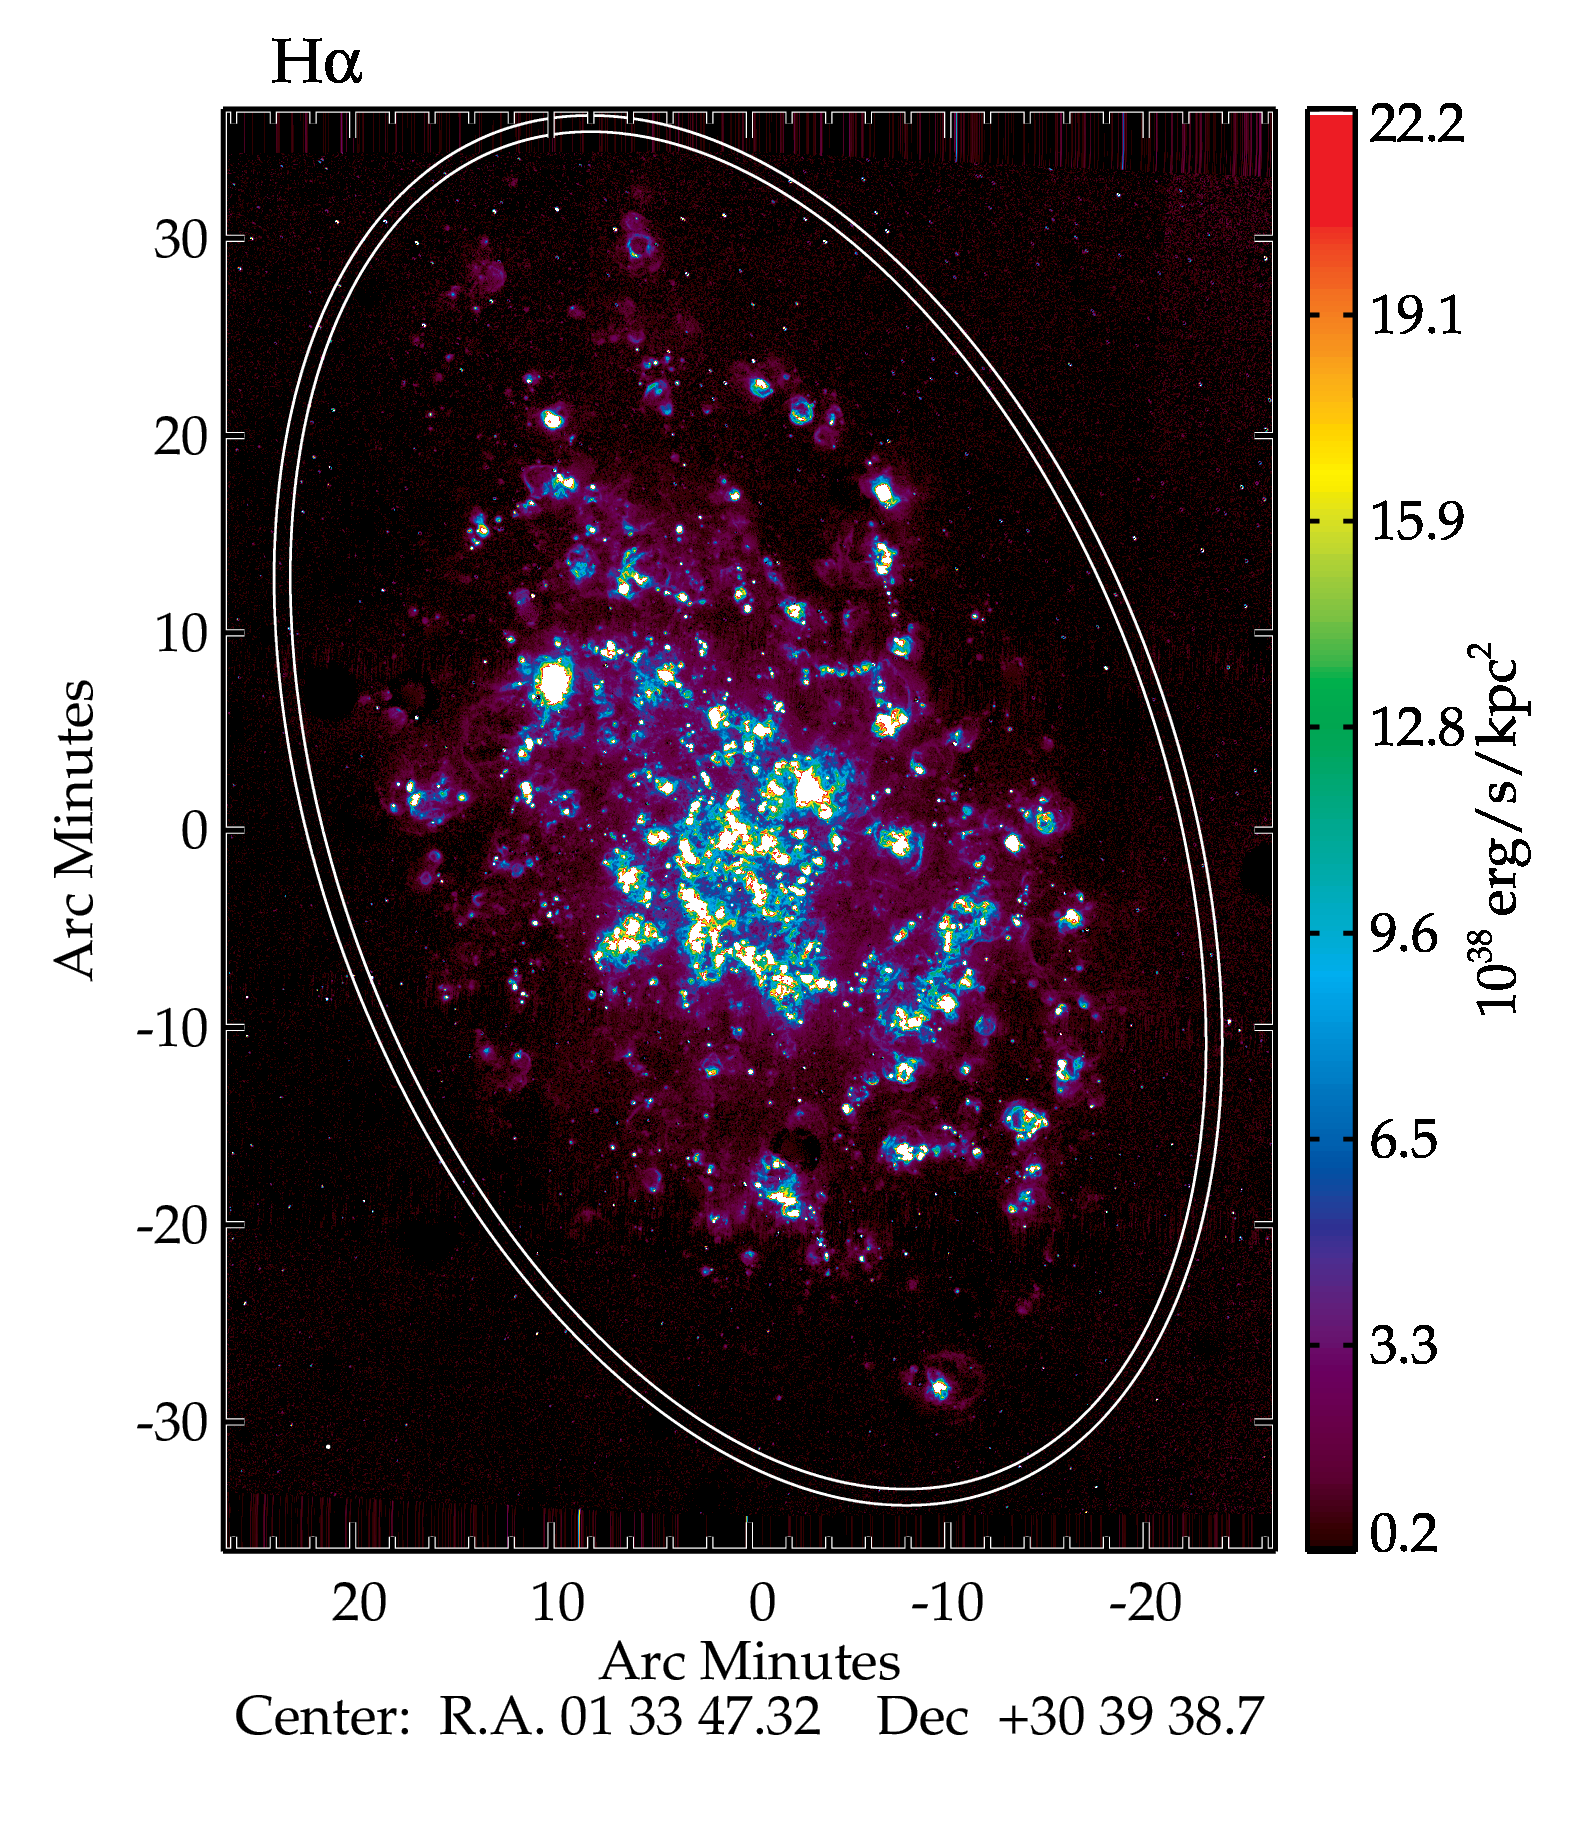
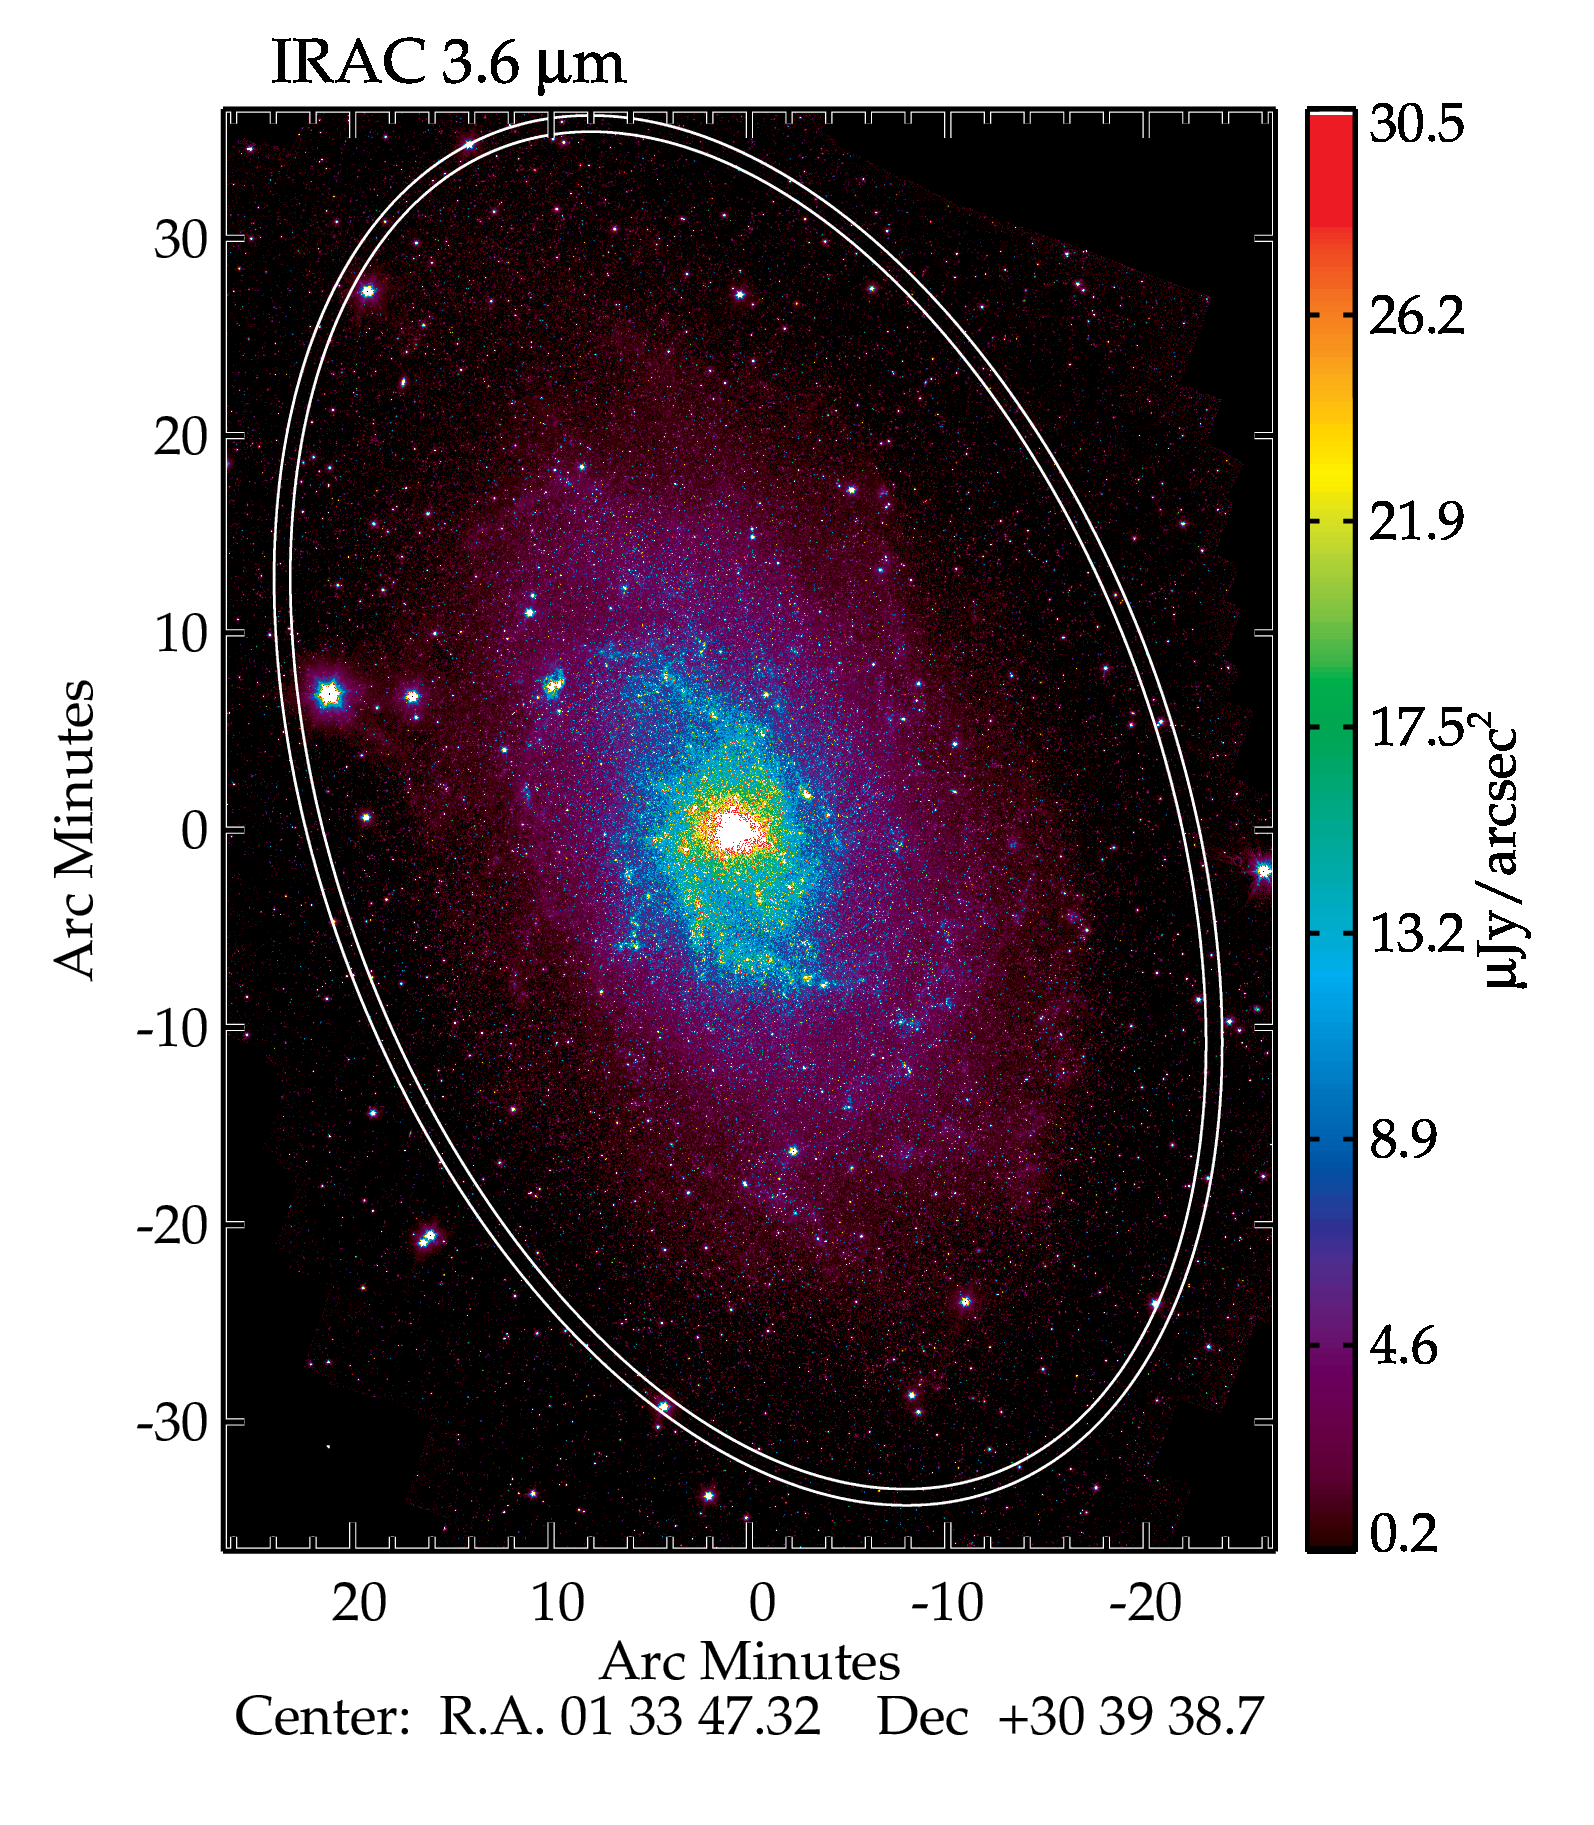
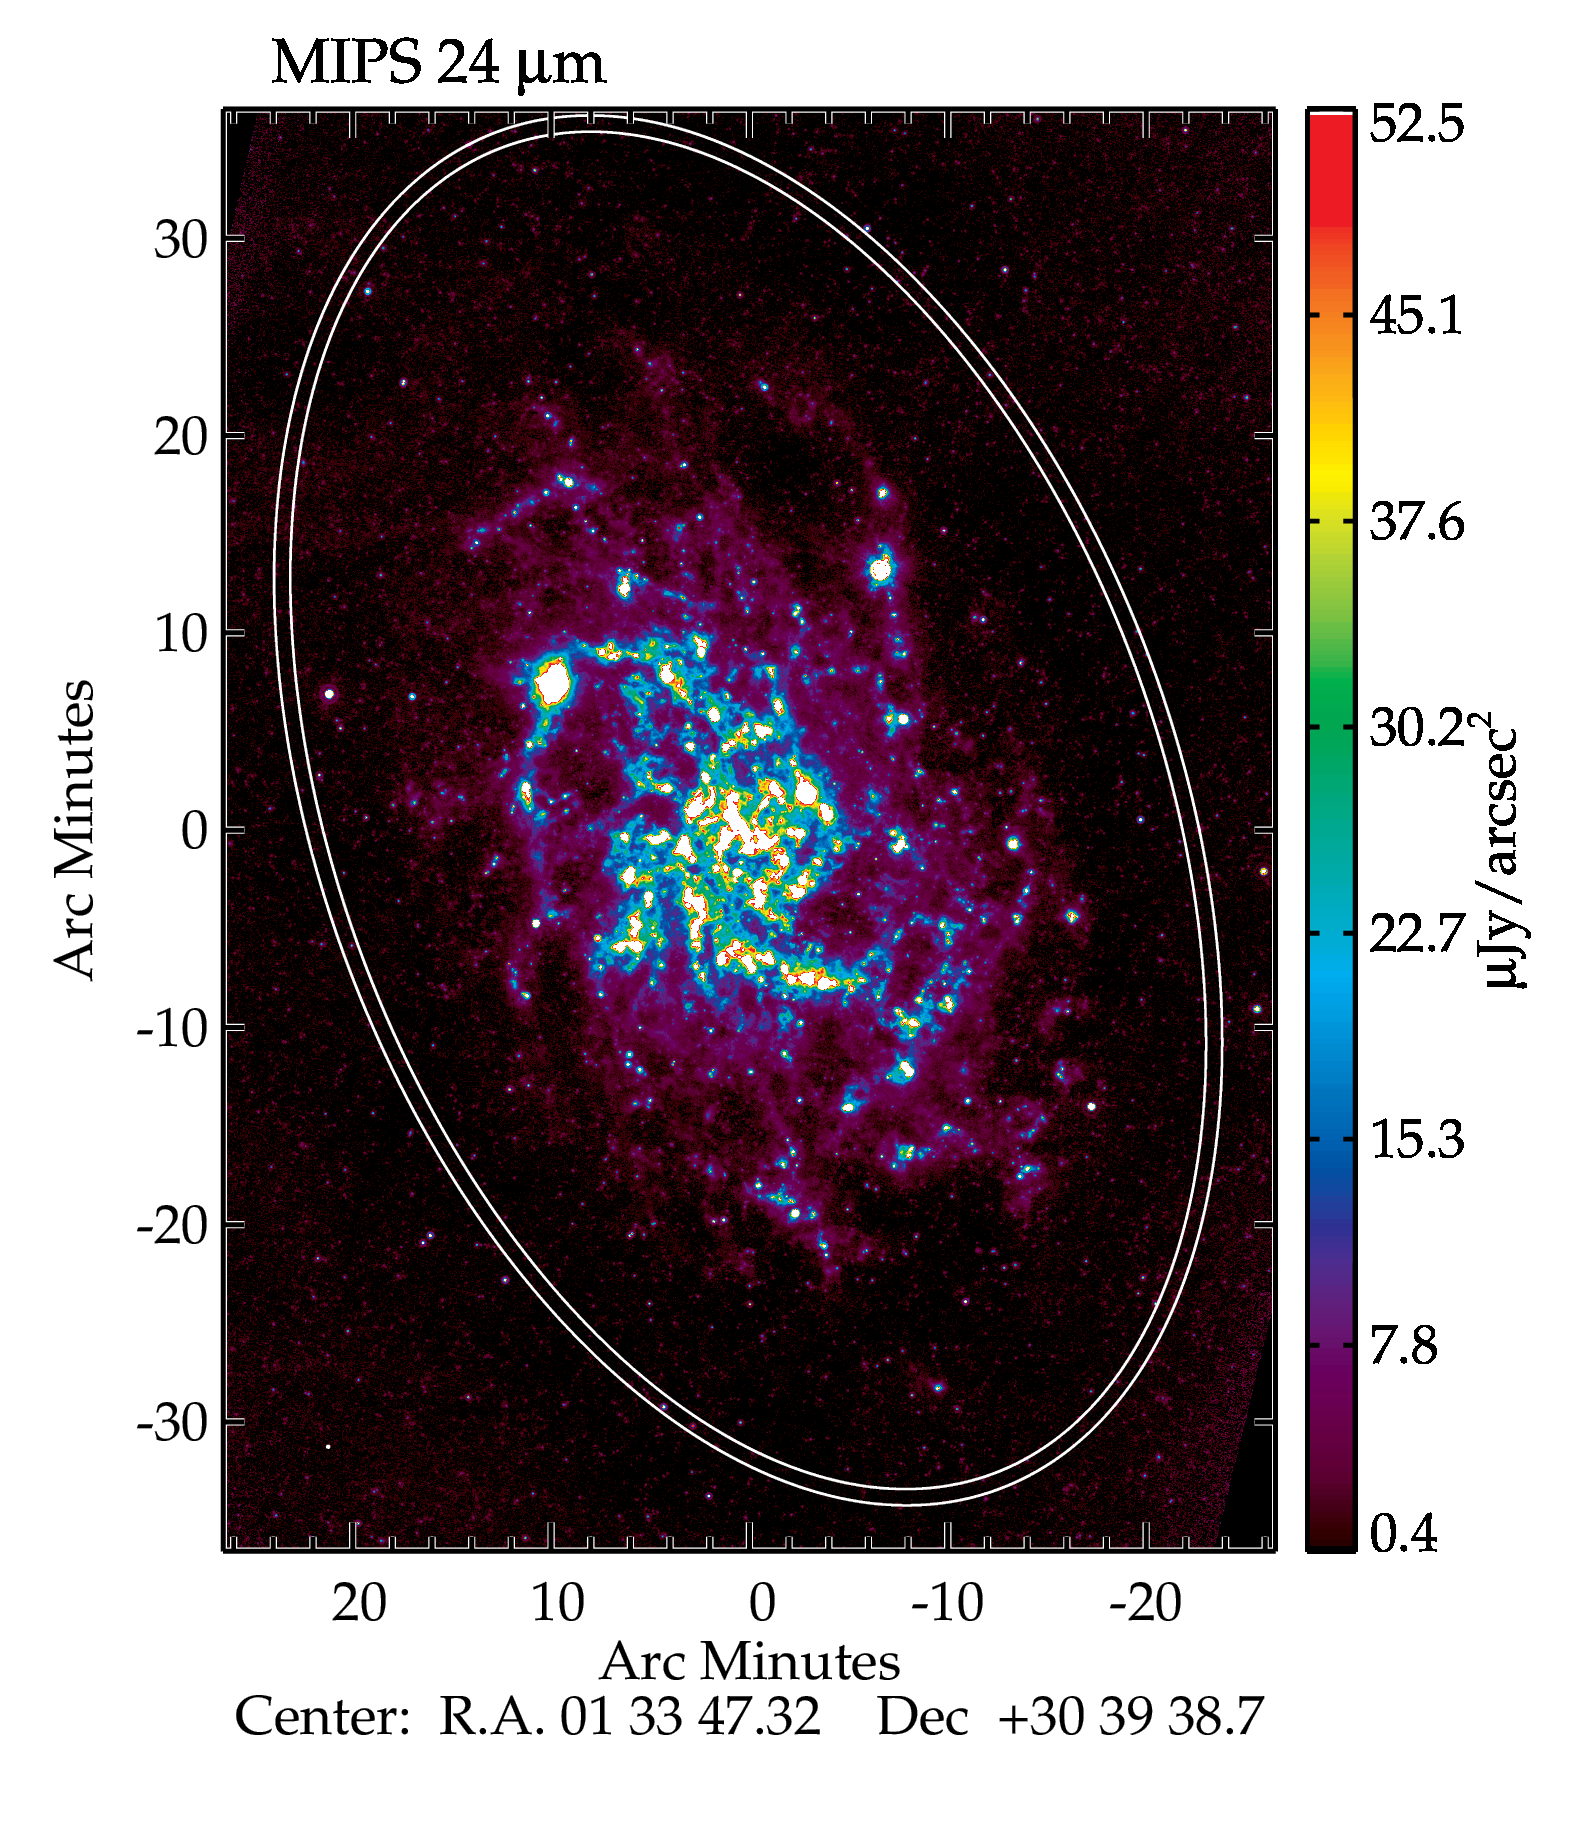
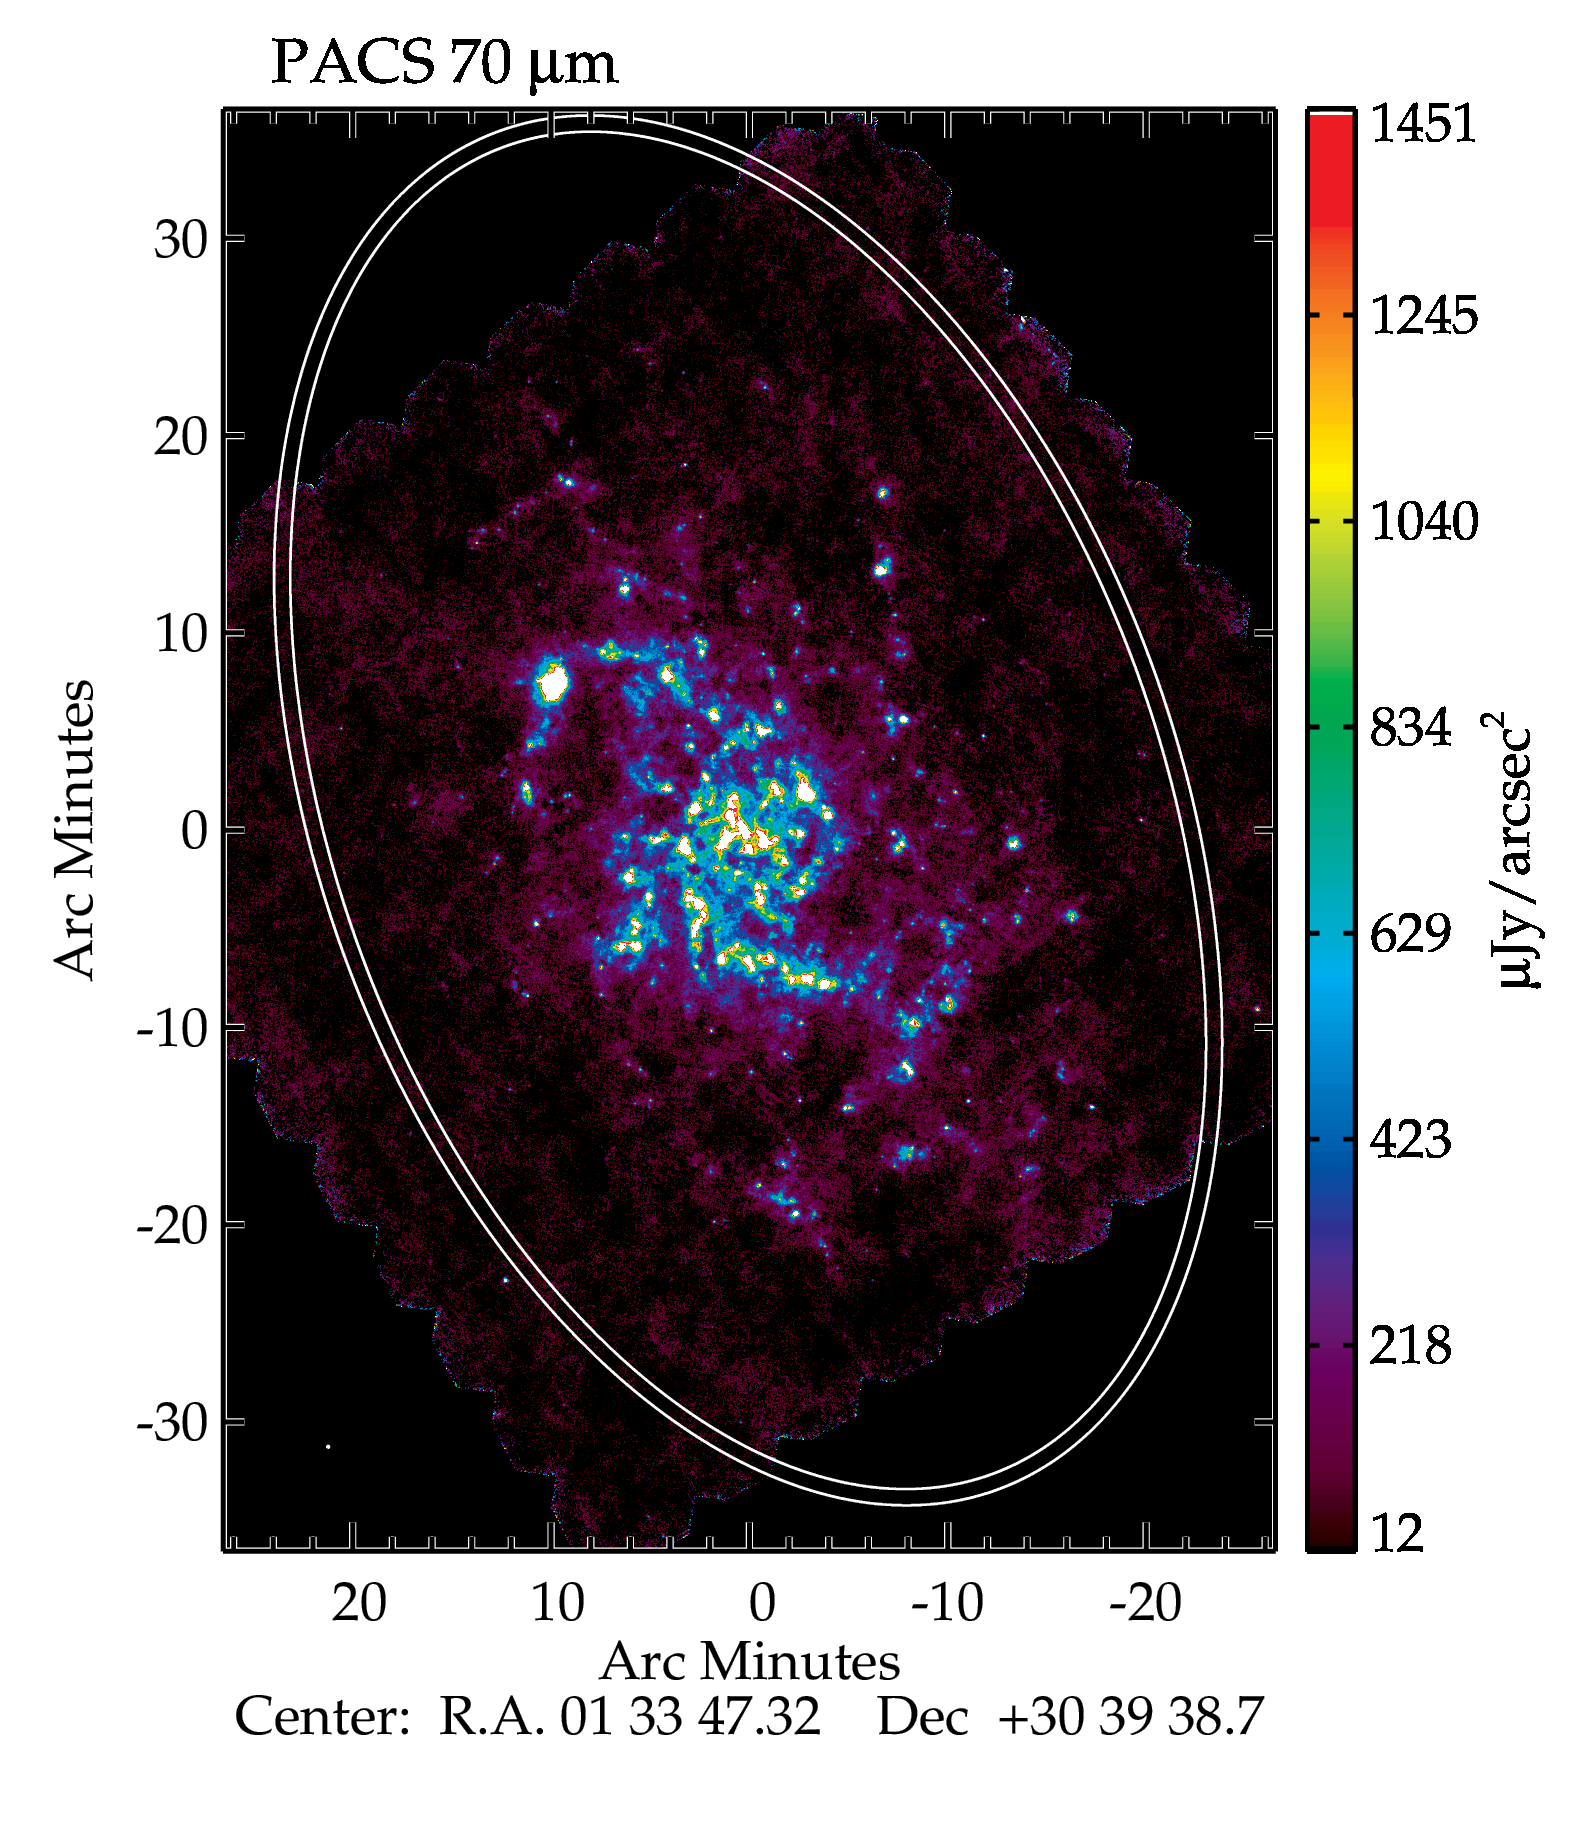
Fig. 1
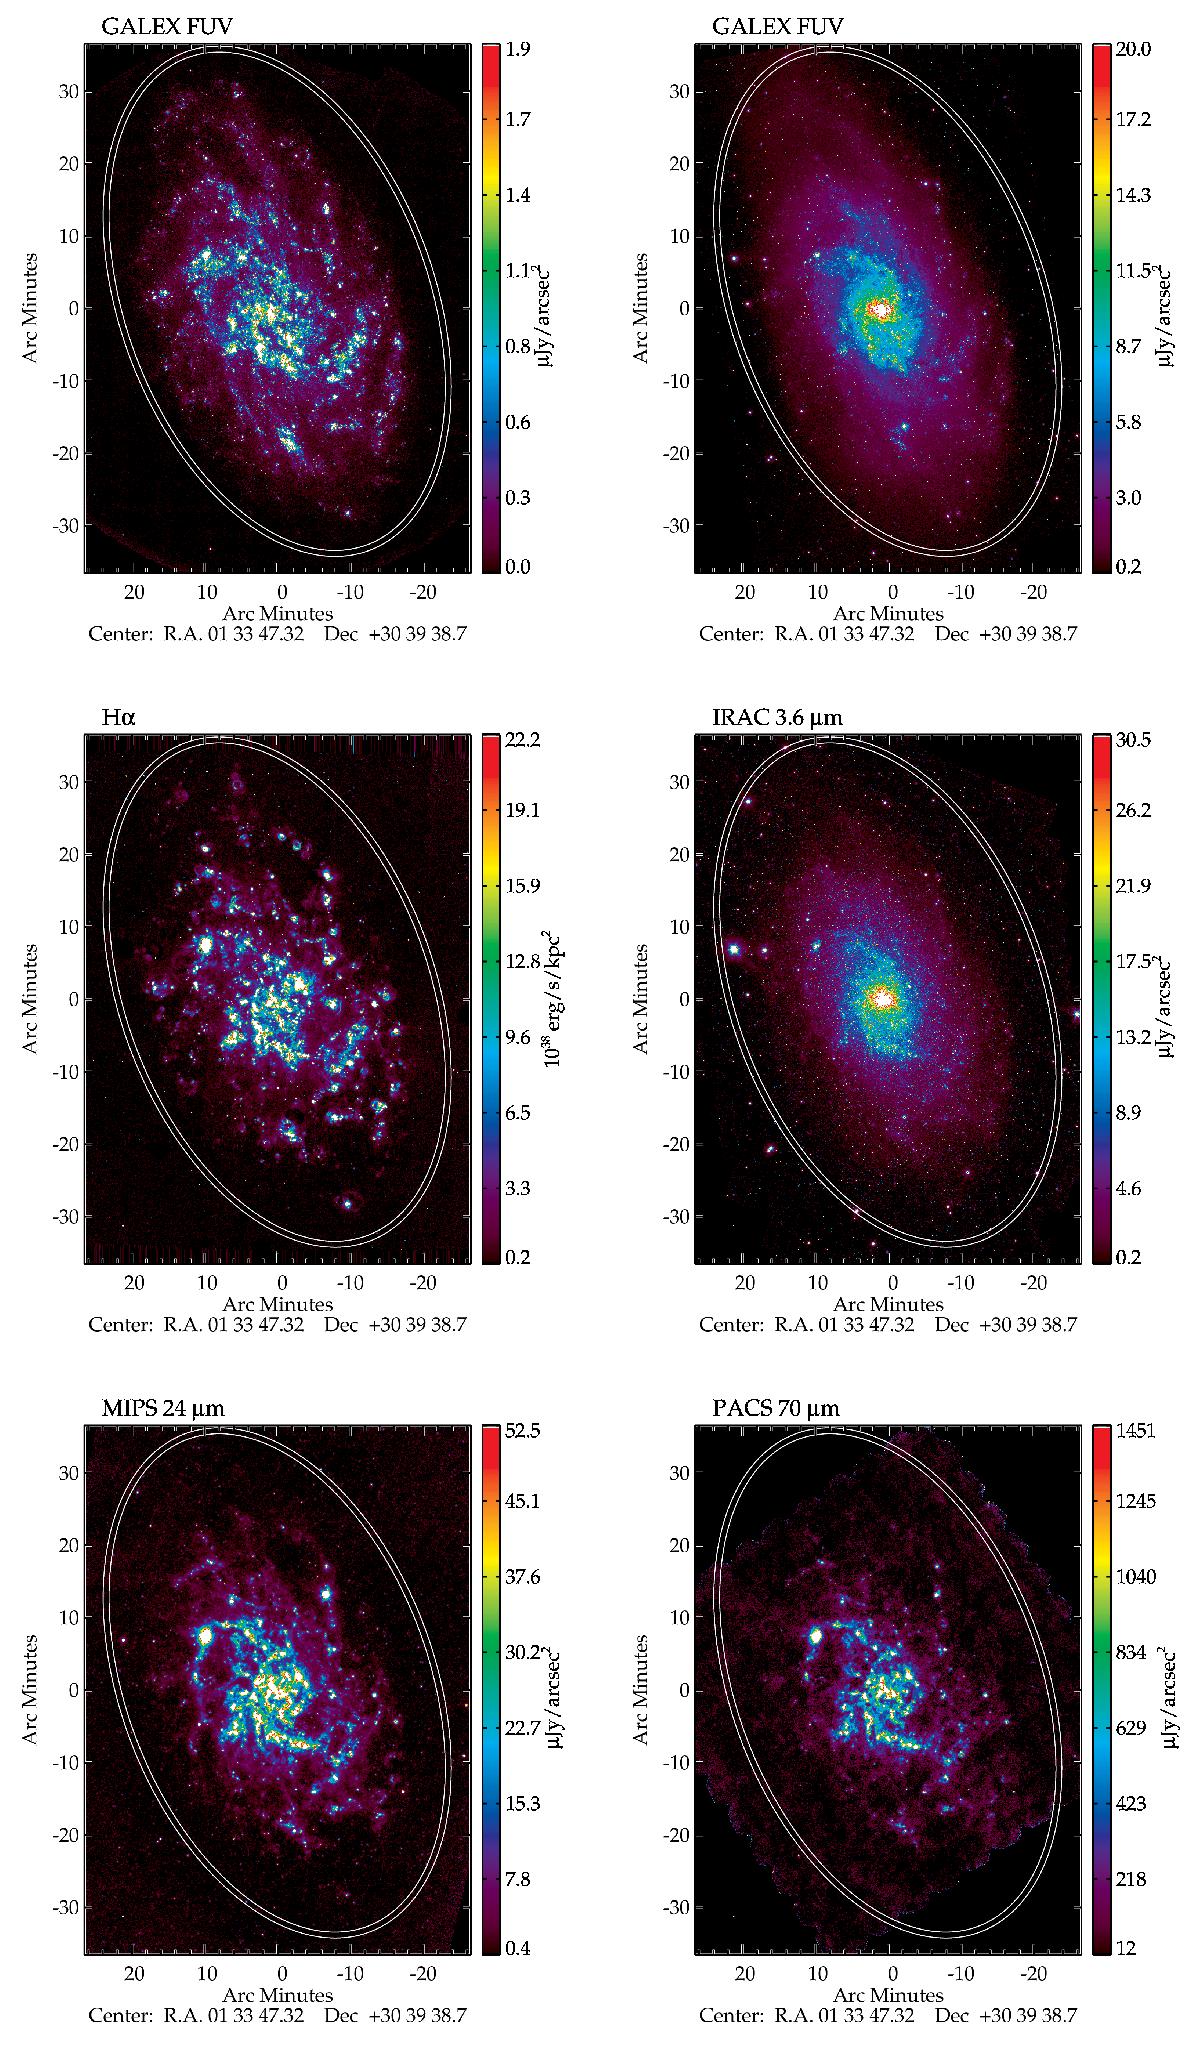
Data of M 33 at their original resolution. Units are homogenized to facilitate the comparison between the different bands. At the distance of M 33, 1″ subtends ~4 pc. The white annulus, used to subtract the local background, is included for reference. The white circle at the bottom left (too tiny to be visible for bands with λ ≲ 350 μm) corresponds to the beam size.
Current usage metrics show cumulative count of Article Views (full-text article views including HTML views, PDF and ePub downloads, according to the available data) and Abstracts Views on Vision4Press platform.
Data correspond to usage on the plateform after 2015. The current usage metrics is available 48-96 hours after online publication and is updated daily on week days.
Initial download of the metrics may take a while.