Fig. 8
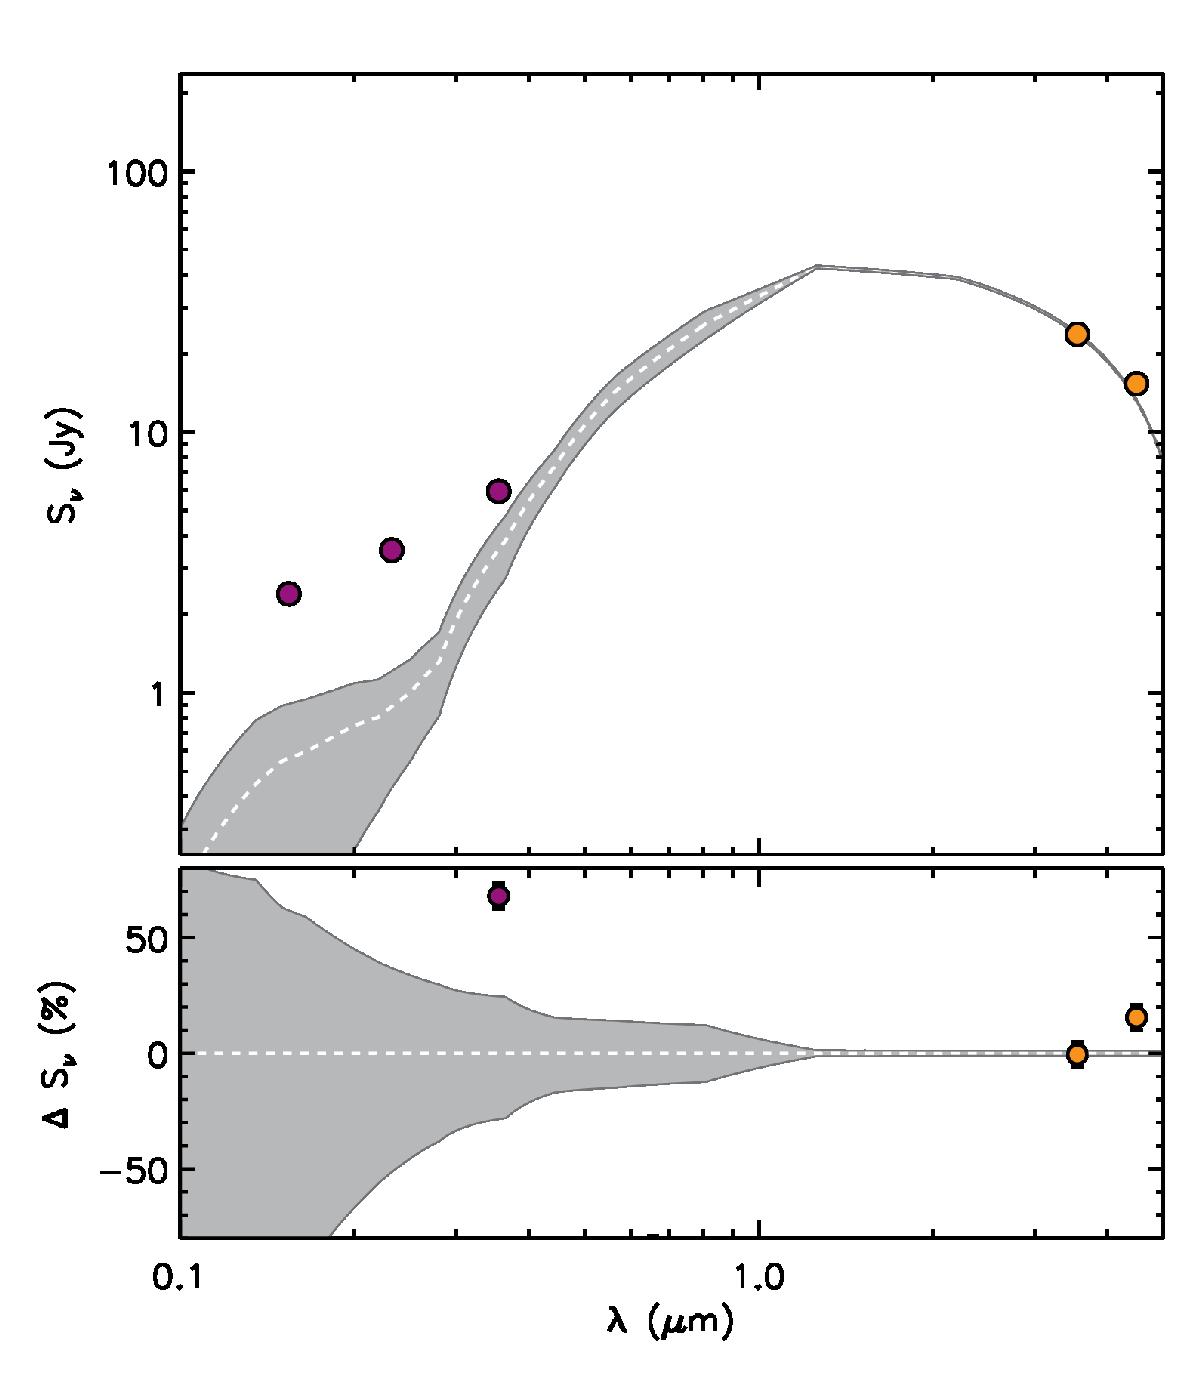
Top: results of the fitting procedure for the stellar component of M 33. The purple and orange filled circles are respectively the observed fluxes of the young and the old stellar populations presented in Table 2. The white dashed line and the gray shaded area correspond to the combination of the attenuated emission and uncertainty of the young and old stellar populations (Sνs,young and Sνs,old, respectively). For clarity, errors are only shown in the bottom panel. Bottom: residuals of the fitting procedure. The filled circles correspond to the percentage difference of the observed fluxes and the best-fitting model (white dashed line). The gray shaded area gives the uncertainty of the best-fitting model in terms of percentage.
Current usage metrics show cumulative count of Article Views (full-text article views including HTML views, PDF and ePub downloads, according to the available data) and Abstracts Views on Vision4Press platform.
Data correspond to usage on the plateform after 2015. The current usage metrics is available 48-96 hours after online publication and is updated daily on week days.
Initial download of the metrics may take a while.