Fig. 2
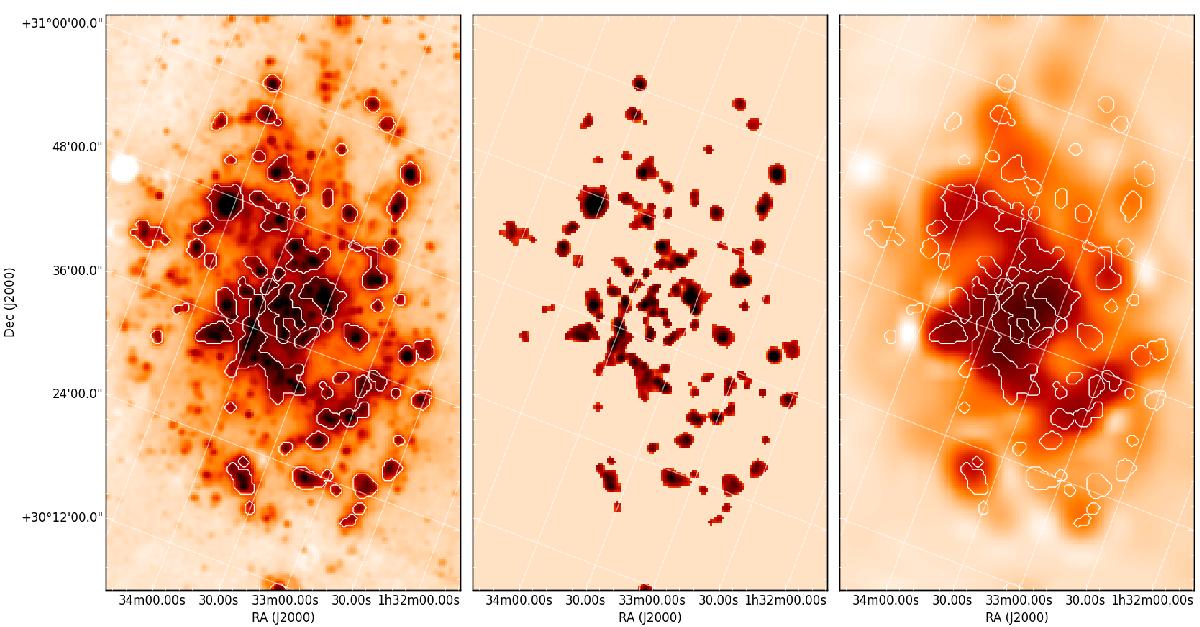
Example of the component separation method for the case of the Hα emission. The left panel is the original Hα image smoothed to the resolution of the SPIRE 500 μm band, the central panel shows the SF regions detected by SExtractor using a threshold of 40, and the right panel corresponds to the diffuse emission. The white contours are included to facilitate the comparison between panels and they correspond to the boundaries of the SF regions. The emission from the SF component represents 41.7% of the total Hα emission.
Current usage metrics show cumulative count of Article Views (full-text article views including HTML views, PDF and ePub downloads, according to the available data) and Abstracts Views on Vision4Press platform.
Data correspond to usage on the plateform after 2015. The current usage metrics is available 48-96 hours after online publication and is updated daily on week days.
Initial download of the metrics may take a while.