Fig. 1
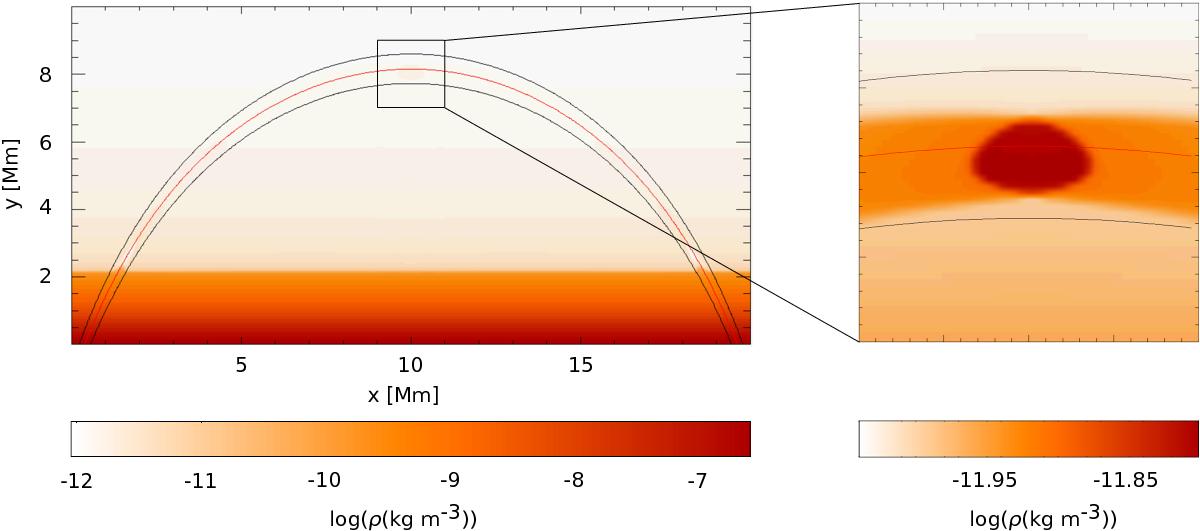
Spatial distribution of plasma mass density at t = 71 s. At this time we observe maximal compression of the plasma at the top of the loop (see the zoomed part) owing to the collision of shocks generated by the temperature (pressure) enhancements at loop footpoints. The solid curved lines show representative magnetic field lines. The red one determines the magnetic field line along the loop axis.
Current usage metrics show cumulative count of Article Views (full-text article views including HTML views, PDF and ePub downloads, according to the available data) and Abstracts Views on Vision4Press platform.
Data correspond to usage on the plateform after 2015. The current usage metrics is available 48-96 hours after online publication and is updated daily on week days.
Initial download of the metrics may take a while.