Fig. 2
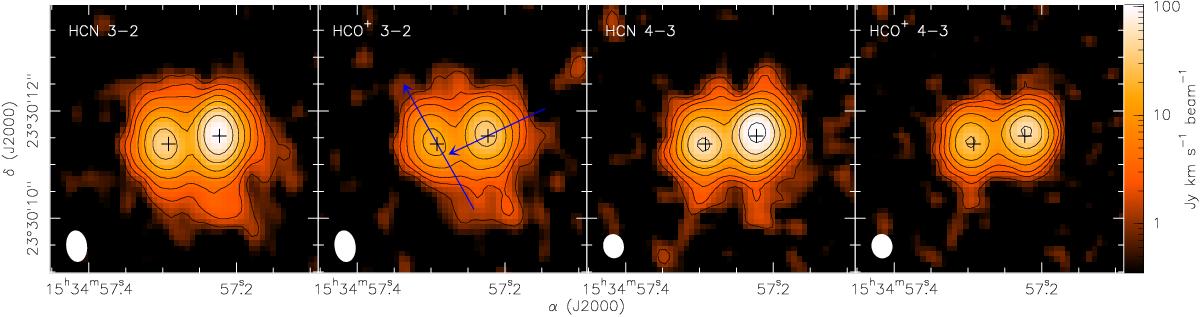
Integrated intensities of HCN 3−2, HCO+ 3−2, HCN 4−3, and HCO+ 4−3 between −400 and 400 km s-1 around the systemic velocity (see Sect. 3.2). Contours represent 3, 6, 10, 20, 40, 80, 150, and 300 σ levels where 1σ = 0.35 Jy km s-1 beam-1. Peaks of continuum emission (Fig. 1) are indicated with crosses. The region shown is the same as in Fig. 1. The blue arrows in the HCO+ 3−2 panel indicate the direction (PA = 30° and 115°) of the P-V cuts in Fig. A.2.
Current usage metrics show cumulative count of Article Views (full-text article views including HTML views, PDF and ePub downloads, according to the available data) and Abstracts Views on Vision4Press platform.
Data correspond to usage on the plateform after 2015. The current usage metrics is available 48-96 hours after online publication and is updated daily on week days.
Initial download of the metrics may take a while.