Fig. 3
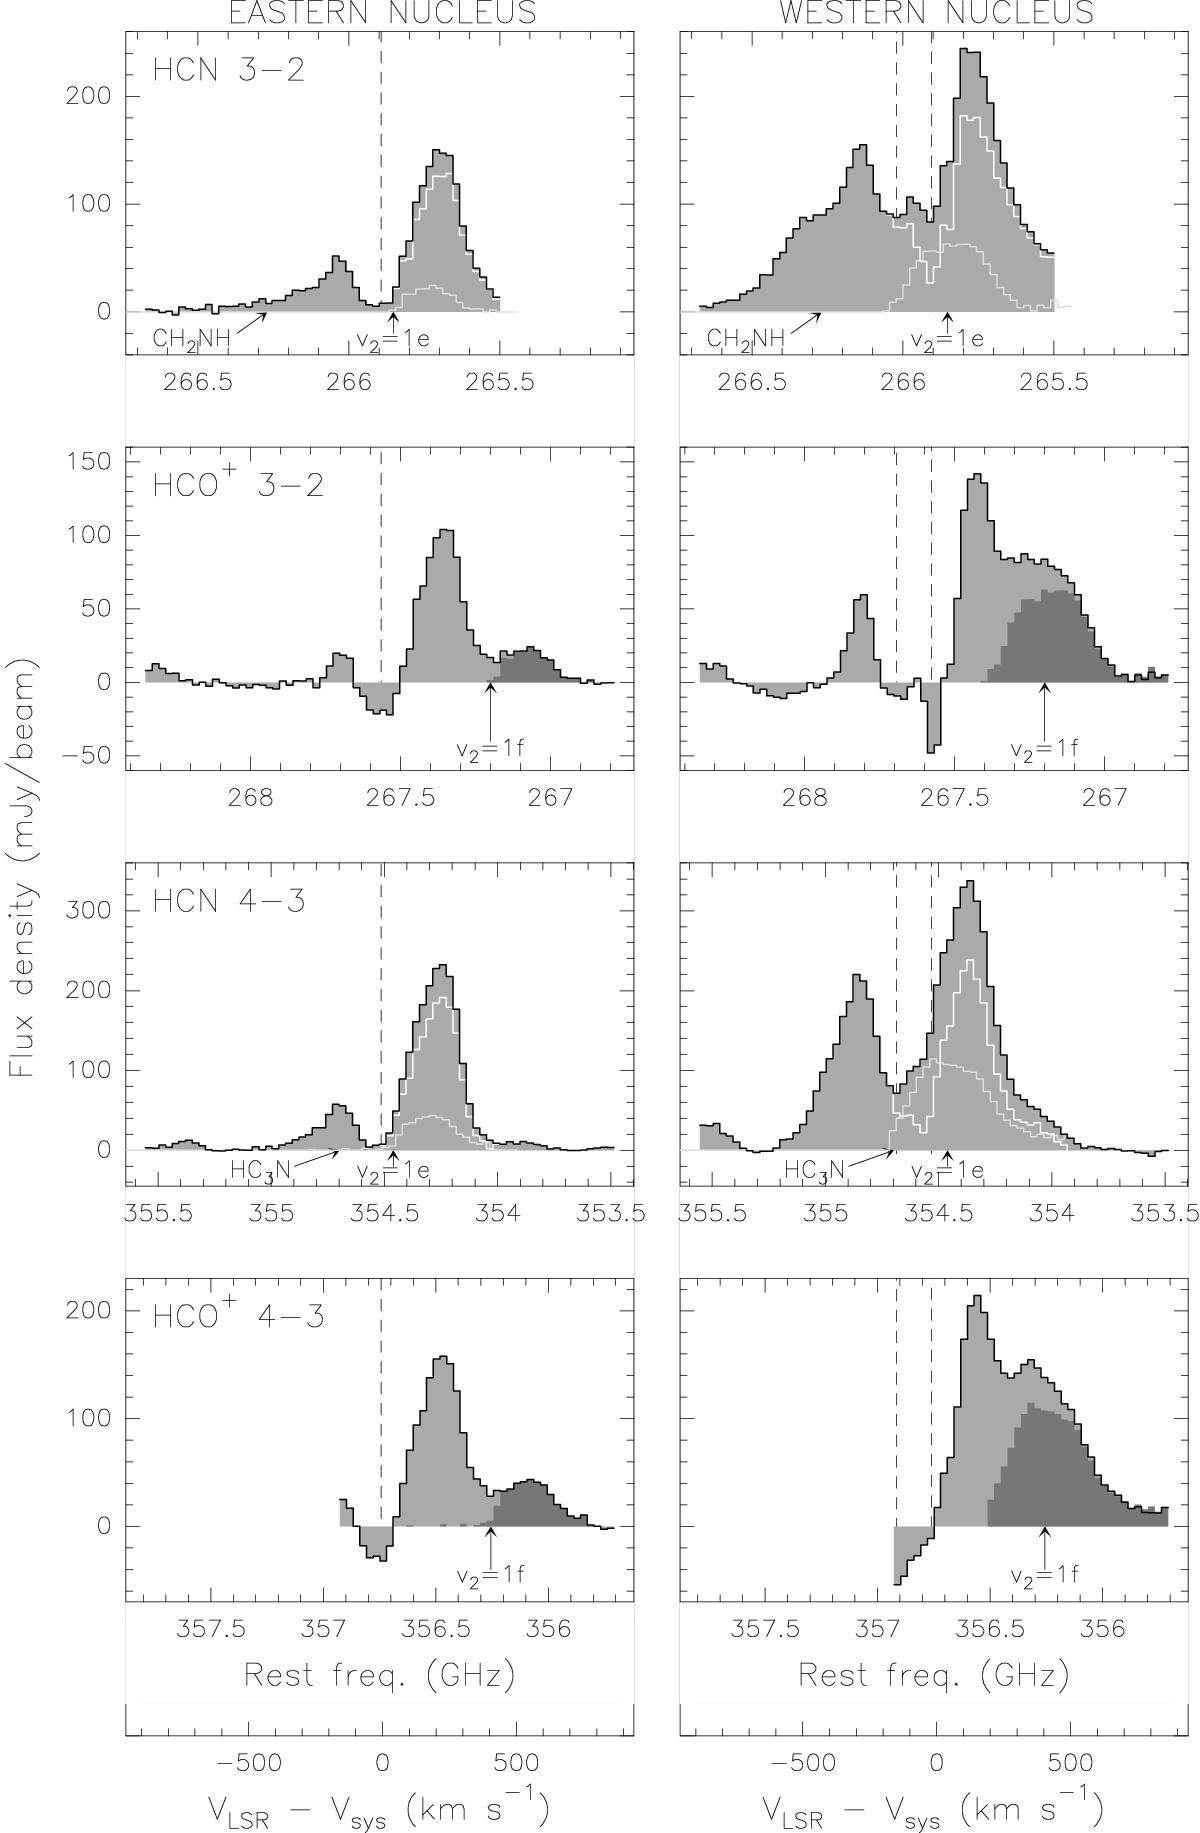
Extracted spectra from the two nuclei in Arp 220 shown as gray histogram and black continuous lines. X-axes are labeled both in rest frequency and at a velocity offset relative to the systemic value (see Sect. 3.2). Observed profiles from the eastern and western nucleus are shown in the left and right columns, respectively. The transition that mostly contributes to the observed spectra is displayed in the top left corner of the left column panels. Vertical dashed lines correspond to the apparent velocities of the absorption systems that affect the line profile for each nucleus (Sect. 3.2.2). The expected position at the systemic velocity of the HCN v = 1e and 1f lines are indicated with labeled arrows. The dark histograms show the HCN v = 1f residual emission after subtracting an estimated line profile (based on HCN) from the HCO+ line (see Sect. 3.3). Pale gray lines show the possible contribution of HCN v = 1e to the HCN emission, while the white lines represent the HCN emission after subtracting the contribution from HCN v = 1e (Sect. 3.3.1). The position of the potential lines of CH2NH and HC3N blended to HCN 3−2 and 4−3, respectively, are also indicated.
Current usage metrics show cumulative count of Article Views (full-text article views including HTML views, PDF and ePub downloads, according to the available data) and Abstracts Views on Vision4Press platform.
Data correspond to usage on the plateform after 2015. The current usage metrics is available 48-96 hours after online publication and is updated daily on week days.
Initial download of the metrics may take a while.