Fig. 4
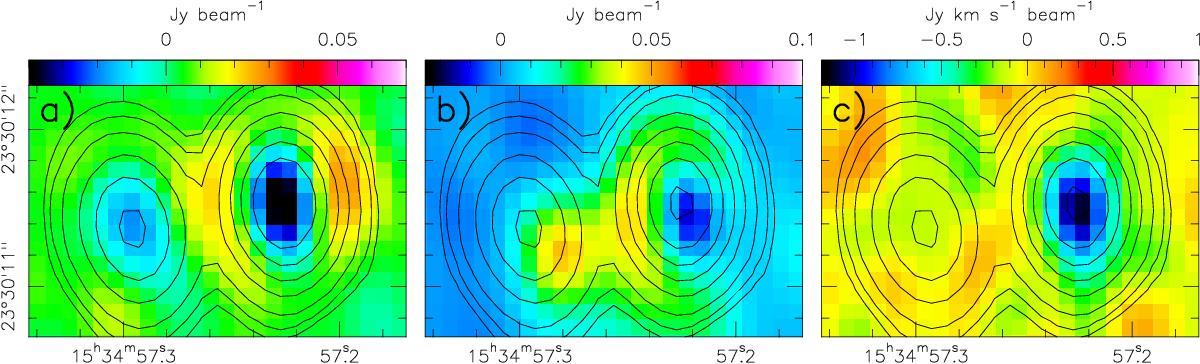
In color: different absorption systems identified in the nuclei of Arp 220 as observed in HCO+3−2. Overlaid, the contours represent the continuum emission. Panels a) and b) show 25 km s-1 individual channels centered on 0 and −150 km s-1, respectively. Panel c) presents the integrated emission in the velocity range [−625, −525 ] km s-1.
Current usage metrics show cumulative count of Article Views (full-text article views including HTML views, PDF and ePub downloads, according to the available data) and Abstracts Views on Vision4Press platform.
Data correspond to usage on the plateform after 2015. The current usage metrics is available 48-96 hours after online publication and is updated daily on week days.
Initial download of the metrics may take a while.