Fig. A.1
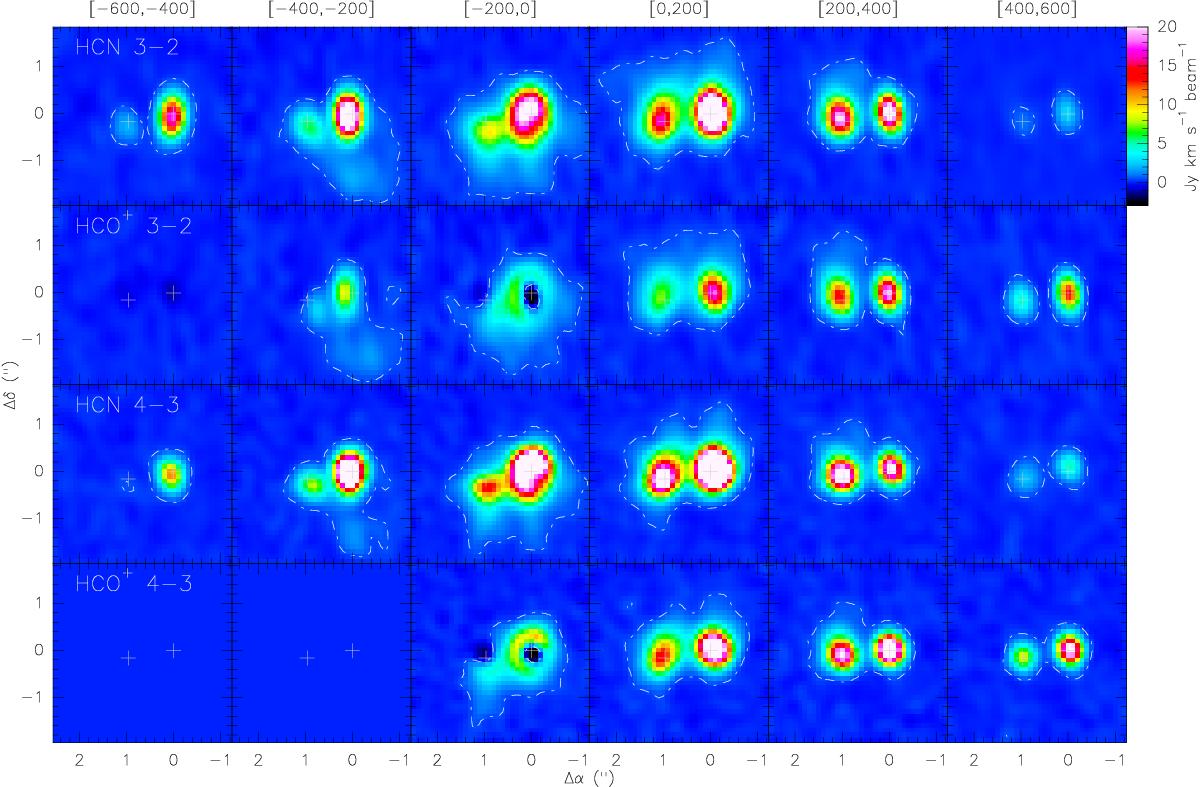
Integrated intensity maps of HCN 3−2, HCO+ 3−2, HCN 4−3, and HCO+ 4−3 in 200 km s-1 bins from –600 to 600 km s-1 around the systemic velocity (see Sect. 3.2). The single dot-dashed contour represents 3σ (1σ = 0.15 mJy km s-1 beam-1) and aims to guide the eye toward the most extended emission. Continuum emission peaks are indicated by gray crosses.
Current usage metrics show cumulative count of Article Views (full-text article views including HTML views, PDF and ePub downloads, according to the available data) and Abstracts Views on Vision4Press platform.
Data correspond to usage on the plateform after 2015. The current usage metrics is available 48-96 hours after online publication and is updated daily on week days.
Initial download of the metrics may take a while.