Fig. A.2
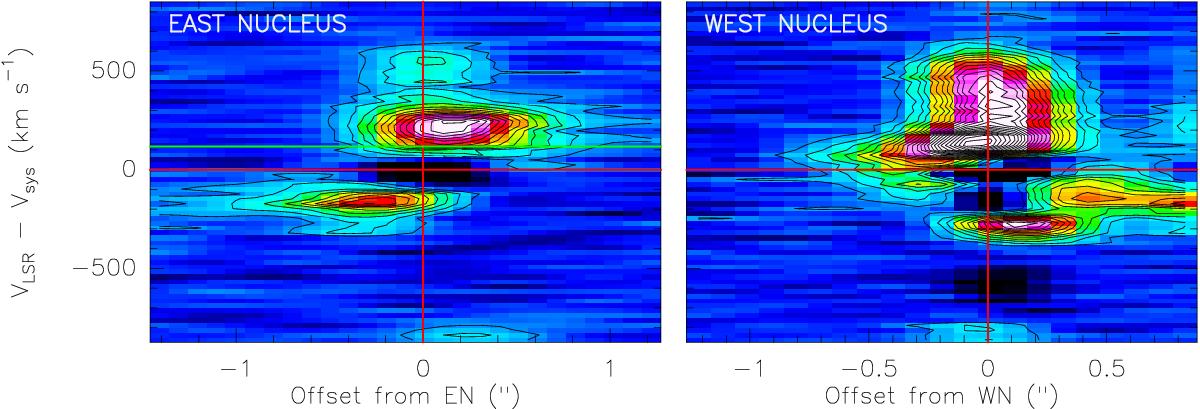
Position-velocity diagrams across the two nuclei for the HCO+3−2 transition. The direction of each cut is shown by blue arrows in Fig. 2. The high-velocity emission extending up to above 500 km s-1 corresponds to the vibrational emission of HCN (Fig. 3). Red lines show the Vsys of the entire system and the position of the nuclei. Toward the EN, the green line shows the derived velocity of the nucleus VEN − Vsys ~ 117 km s-1.
Current usage metrics show cumulative count of Article Views (full-text article views including HTML views, PDF and ePub downloads, according to the available data) and Abstracts Views on Vision4Press platform.
Data correspond to usage on the plateform after 2015. The current usage metrics is available 48-96 hours after online publication and is updated daily on week days.
Initial download of the metrics may take a while.