Fig. 1
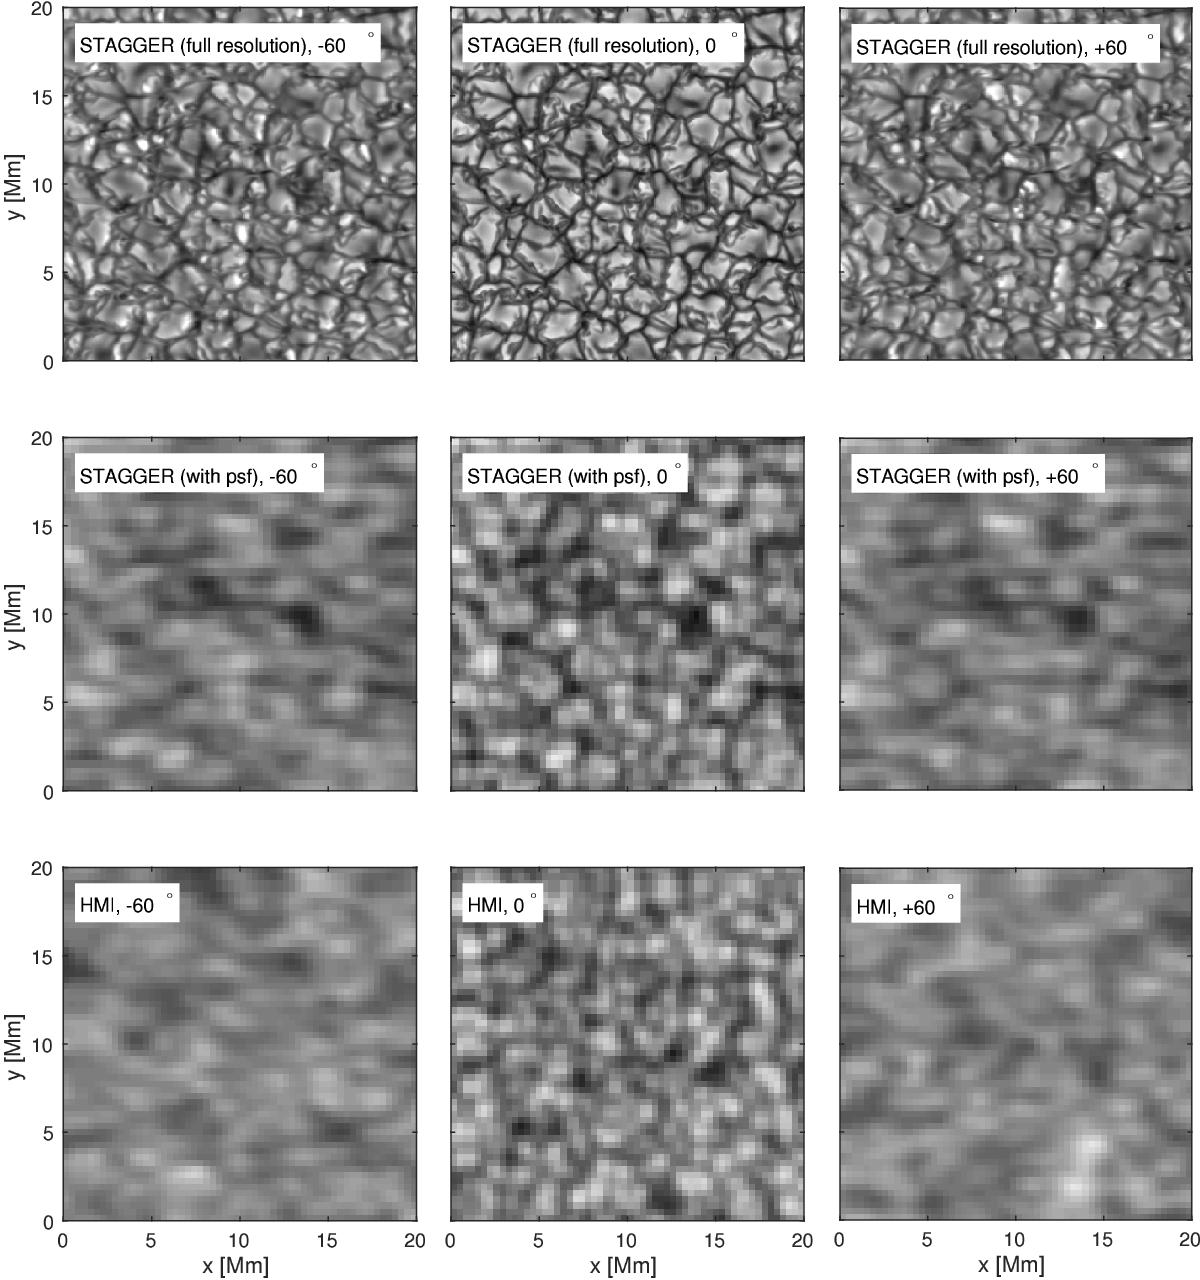
Overview of the various datasets used in this study. Top row: continuum intensity maps derived from the STAGGER simulations (full spatial resolution); middle row: same as above but convolved with a point spread function (PSF; taken from Couvidat et al. 2016, with γ = 2.5); and bottom row: continuum intensity maps provided by the HMI instrument (different longitudes along the equator), obtained on 7 June 2010 (B0 = 0°). All of the datasets are shown for three different viewing angles, −60° (left column, right side points toward disk center), 0° (middle column), and + 60° (right column, left side points toward disk center). The HMI data and the synthetic data convolved with the PSF are plotted on the same scale.
Current usage metrics show cumulative count of Article Views (full-text article views including HTML views, PDF and ePub downloads, according to the available data) and Abstracts Views on Vision4Press platform.
Data correspond to usage on the plateform after 2015. The current usage metrics is available 48-96 hours after online publication and is updated daily on week days.
Initial download of the metrics may take a while.