Fig. 1
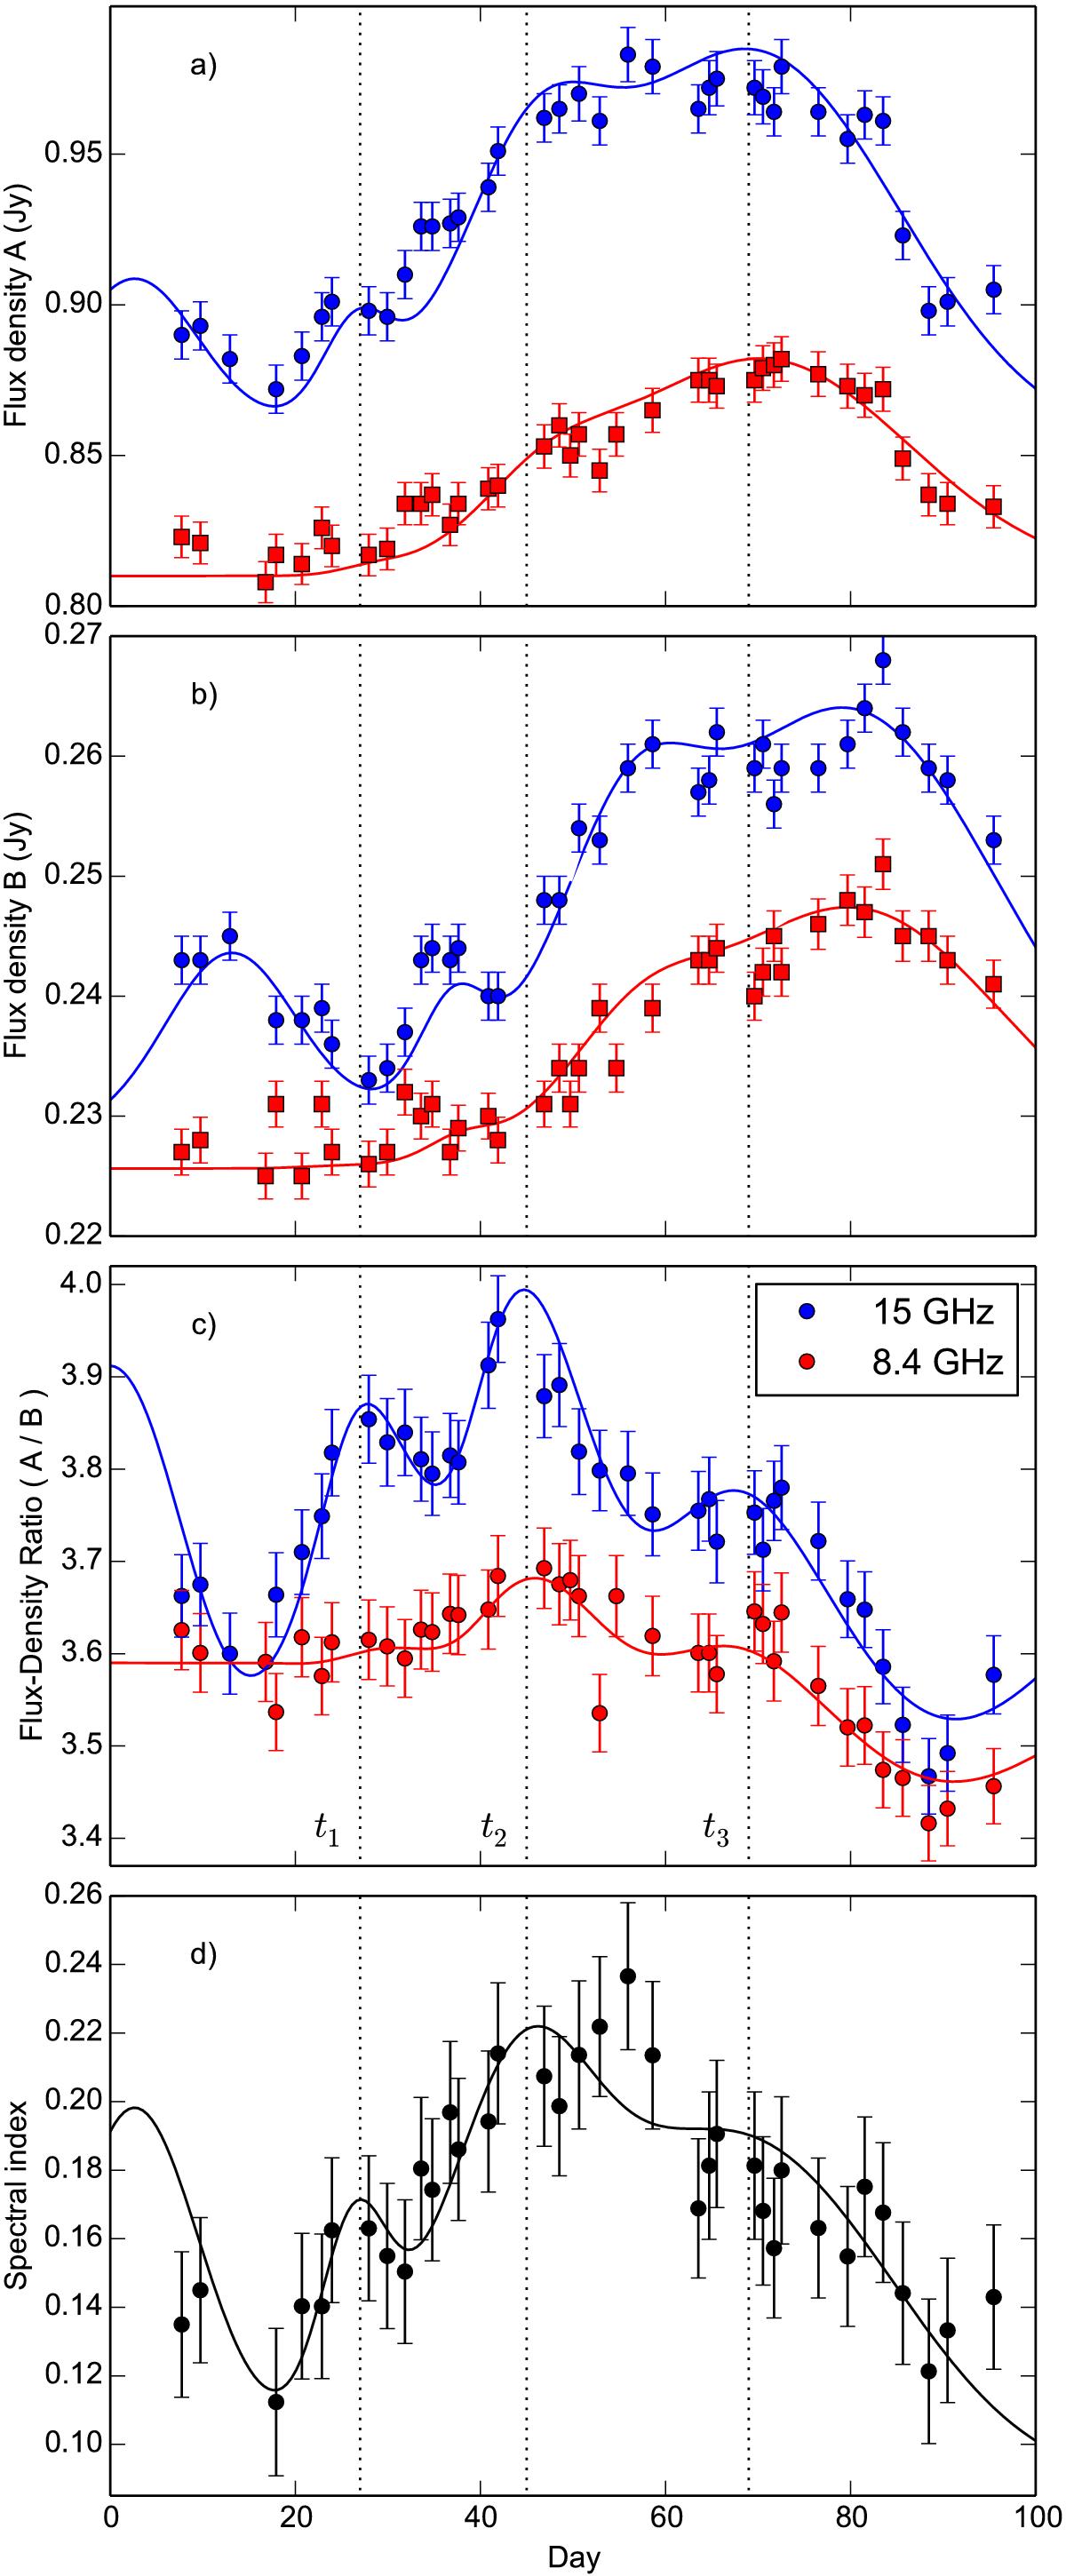
From top to bottom: a) evolution of the flux density of image A; b) evolution of flux-density of image B; c) flux-density ratio (A/B); and d) spectral index of image A. The dotted lines mark local maxima in the evolution of the flux-density ratio at 15 GHz. The continuum lines are our model to the data (the 8.4 GHz model is derived from that at 15 GHz by an opacity correction with Eq. (3), see text).
Current usage metrics show cumulative count of Article Views (full-text article views including HTML views, PDF and ePub downloads, according to the available data) and Abstracts Views on Vision4Press platform.
Data correspond to usage on the plateform after 2015. The current usage metrics is available 48-96 hours after online publication and is updated daily on week days.
Initial download of the metrics may take a while.