Fig. 2
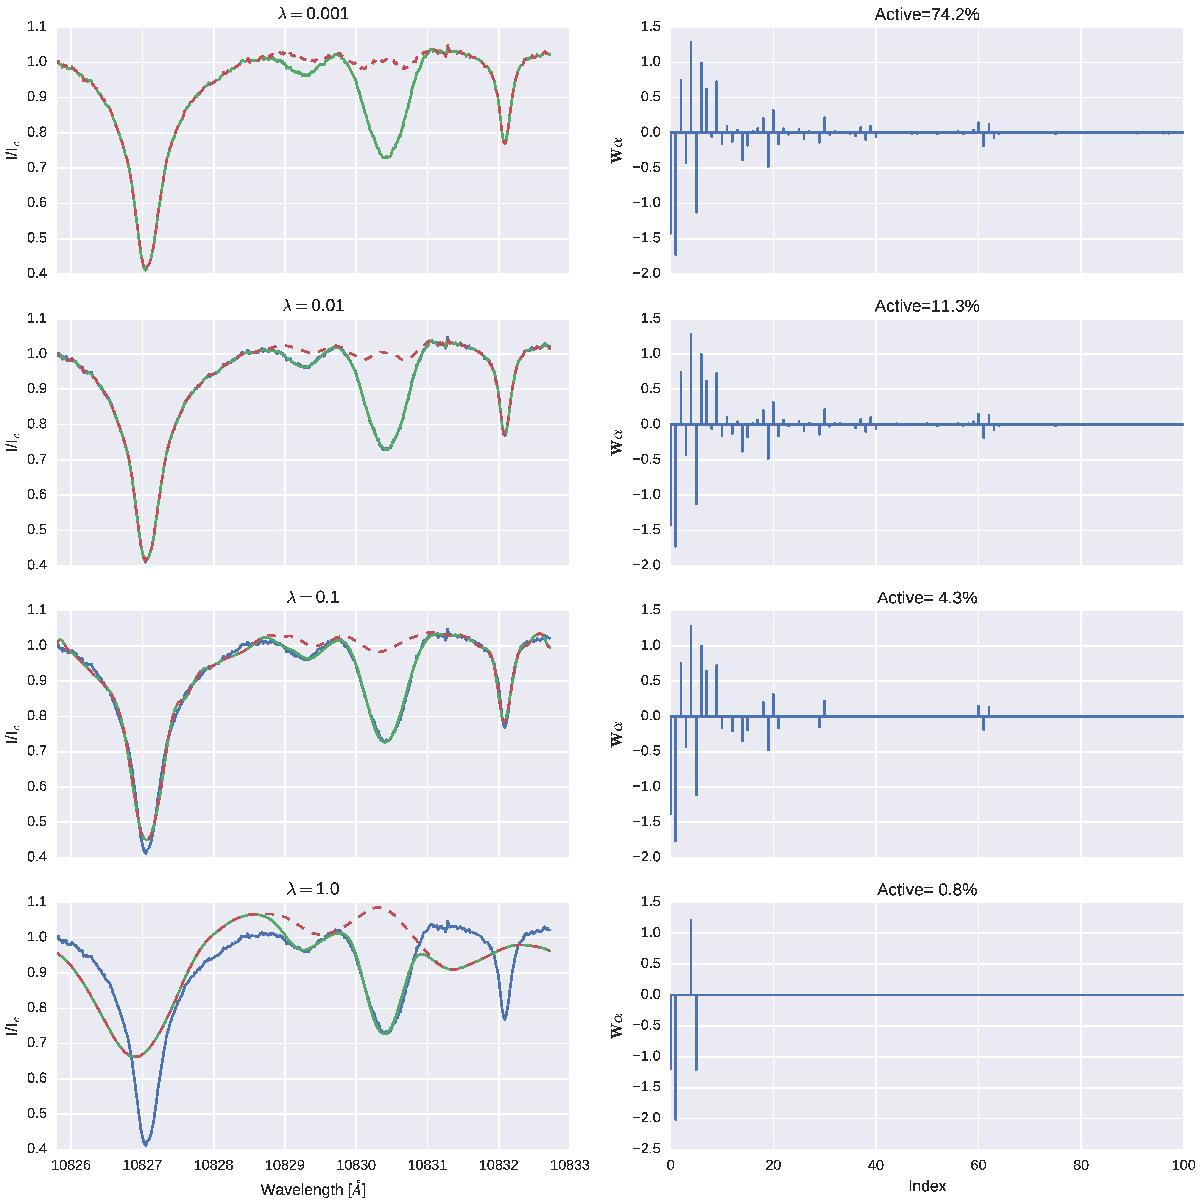
Left panels: observed (blue) and fitted (green) Stokes I profile for different values of the regularization parameters λ and using an orthogonal wavelet transform as the sparsity-inducing transformation. The dashed red curve shows the inferred systematic effects. The spectral range corresponds to that around the He i multiplet at 10 830 Å. Right panels: first 100 active wavelet coefficients of the set of 512 total coefficients. The percentage of active functions is shown in each panel.
Current usage metrics show cumulative count of Article Views (full-text article views including HTML views, PDF and ePub downloads, according to the available data) and Abstracts Views on Vision4Press platform.
Data correspond to usage on the plateform after 2015. The current usage metrics is available 48-96 hours after online publication and is updated daily on week days.
Initial download of the metrics may take a while.