Fig. 5
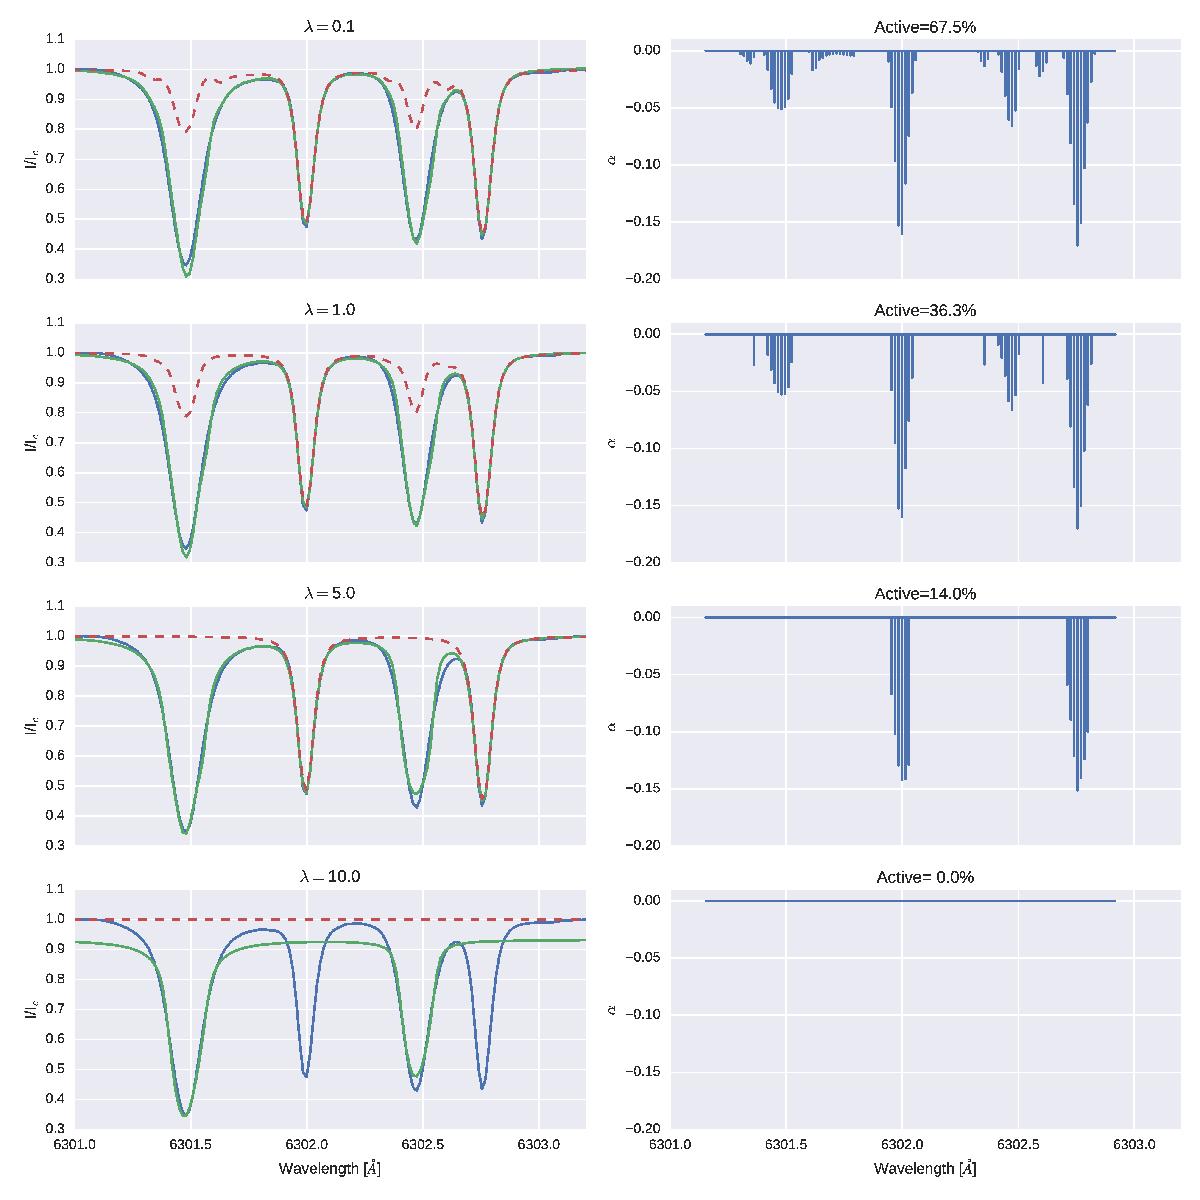
Observed (blue) and fitted (green) Stokes I profile for different values of the regularization parameters λ and using a dictionary made of Voigt functions centered at every pixel. The dashed red curve shows the inferred systematic effects. The left panels show the results for the Fe i lines, while the right panels show the active functions, with the label indicating the percentage of active functions.
Current usage metrics show cumulative count of Article Views (full-text article views including HTML views, PDF and ePub downloads, according to the available data) and Abstracts Views on Vision4Press platform.
Data correspond to usage on the plateform after 2015. The current usage metrics is available 48-96 hours after online publication and is updated daily on week days.
Initial download of the metrics may take a while.