Fig. 2
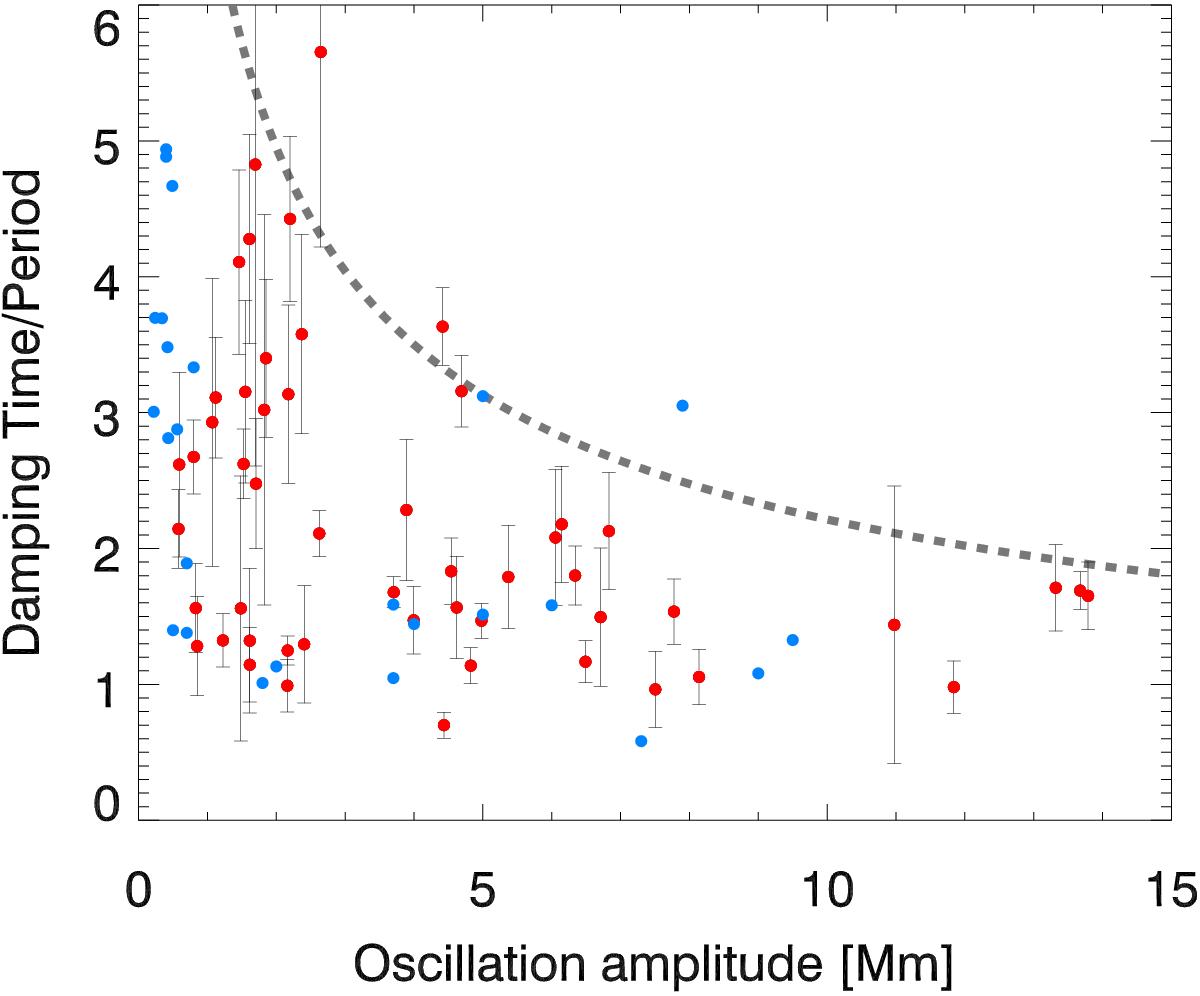
Quality factor of kink oscillations of coronal loops determined as the ratio of damping time to the oscillation period, plotted against the apparent oscillation amplitude. The red points are taken from Goddard et al. (2016). The blue points correspond to those listed in Table 1. The grey line shows the scaling of the quality factor with the maximum apparent (actual) amplitude.
Current usage metrics show cumulative count of Article Views (full-text article views including HTML views, PDF and ePub downloads, according to the available data) and Abstracts Views on Vision4Press platform.
Data correspond to usage on the plateform after 2015. The current usage metrics is available 48-96 hours after online publication and is updated daily on week days.
Initial download of the metrics may take a while.