Fig. 3
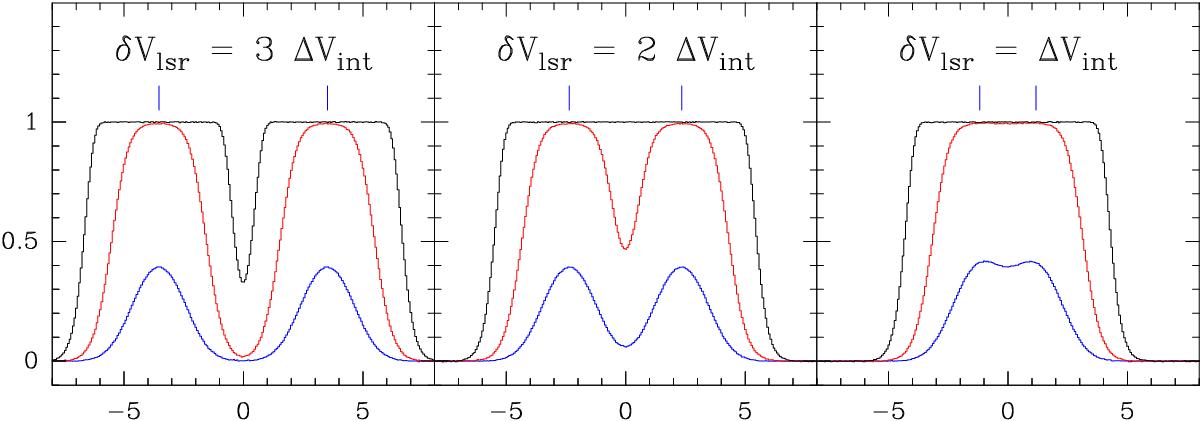
Line blending effects as a function of the velocity difference δVlsr between two adjacent components separated three (left), two (center), and one (right) times their intrinsic linewidth ΔVint. Central line opacities of τ0 = 0.5 (blue), τ0 = 5 (red), and τ0 = 100 (black) are considered as representative of the three main CO isotopologues, C18O, 13CO, and 12CO, respectively. The central velocities of the two components forming each spectrum are indicated with blue lines. In the case of complex spectra with multiple components close in velocity (δVlsr ≲ 2ΔV), the individual lines can only be identified using optically thin tracers.
Current usage metrics show cumulative count of Article Views (full-text article views including HTML views, PDF and ePub downloads, according to the available data) and Abstracts Views on Vision4Press platform.
Data correspond to usage on the plateform after 2015. The current usage metrics is available 48-96 hours after online publication and is updated daily on week days.
Initial download of the metrics may take a while.