Fig. 4
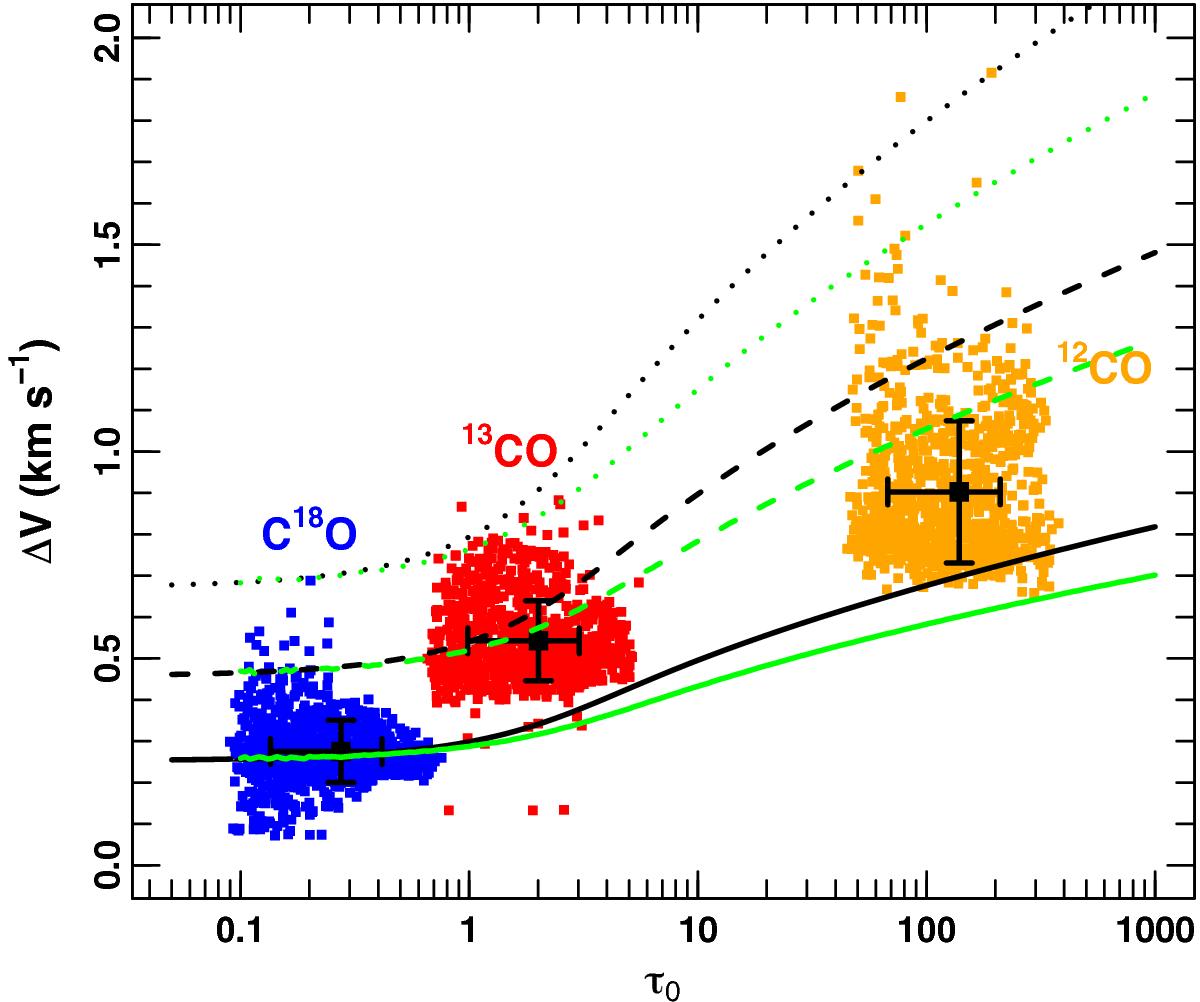
Observed C18O (1−0) (blue), 13CO (red), and 12CO (1−0) (orange) linewidths (ΔV) as a function of the central opacity (τ0) for all positions detected in L1517 with S/N(C18O) ≥ 3 (>940 points per molecule). The mean and standard deviation of these measurements of each isotopologue are indicated by black squares and bars. The distinct curves correspond to the predicted opacity broadening of lines with an intrinsic Doppler broadening described by a thermal component at 10 K and a non-thermal velocity dispersion of 0.5 cs (solid line), 1.0 cs (long dashed line), and 1.5 cs (dotted line). In each case, this figure displays the comparison between the expected values for the opacity broadening derived from the analytic solution in Eq. (4) (black lines) with the measurements obtained from their corresponding Gaussian fits to the spectra (green lines).
Current usage metrics show cumulative count of Article Views (full-text article views including HTML views, PDF and ePub downloads, according to the available data) and Abstracts Views on Vision4Press platform.
Data correspond to usage on the plateform after 2015. The current usage metrics is available 48-96 hours after online publication and is updated daily on week days.
Initial download of the metrics may take a while.