Fig. 8
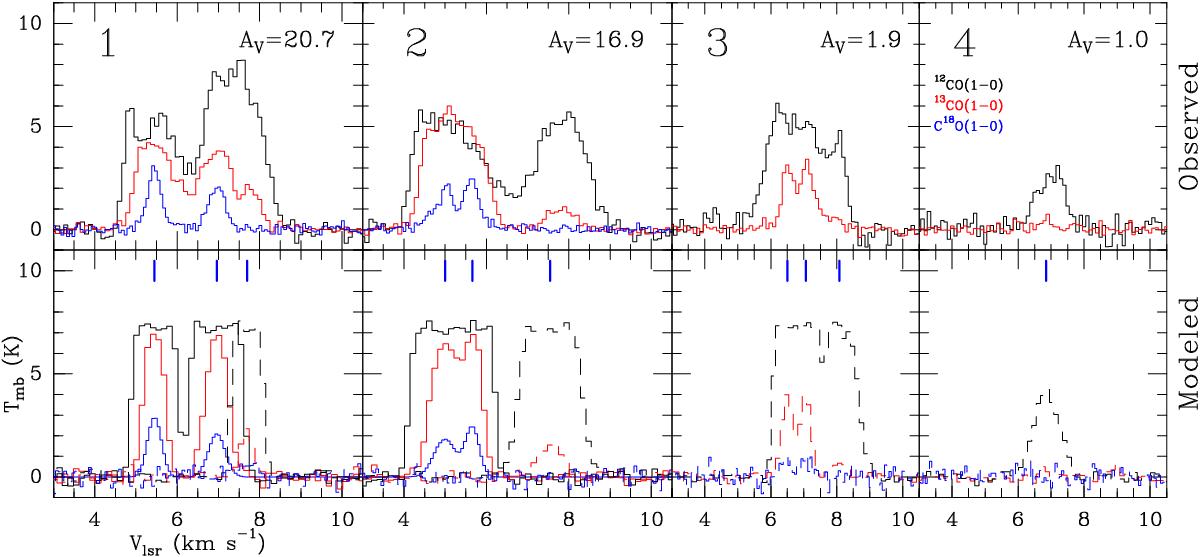
Observed (upper panel) and modeled (lower panel) C18O (1−0) (blue), 13CO (red), and 12CO (1−0) (black) line emission the B213-L1495 region (positions 1 to 4). The location of these spectra are indicated in the map in Fig. 7. The total visual extinction of gas at these positions, derived from Herschel continuum observations, are indicated in the upper right corner. Multiple peaks are identified in the 13CO and 12CO spectra when these lines become optically thin (e.g., position 3). Symbols and lines as in Fig. 6.
Current usage metrics show cumulative count of Article Views (full-text article views including HTML views, PDF and ePub downloads, according to the available data) and Abstracts Views on Vision4Press platform.
Data correspond to usage on the plateform after 2015. The current usage metrics is available 48-96 hours after online publication and is updated daily on week days.
Initial download of the metrics may take a while.