Fig. 6
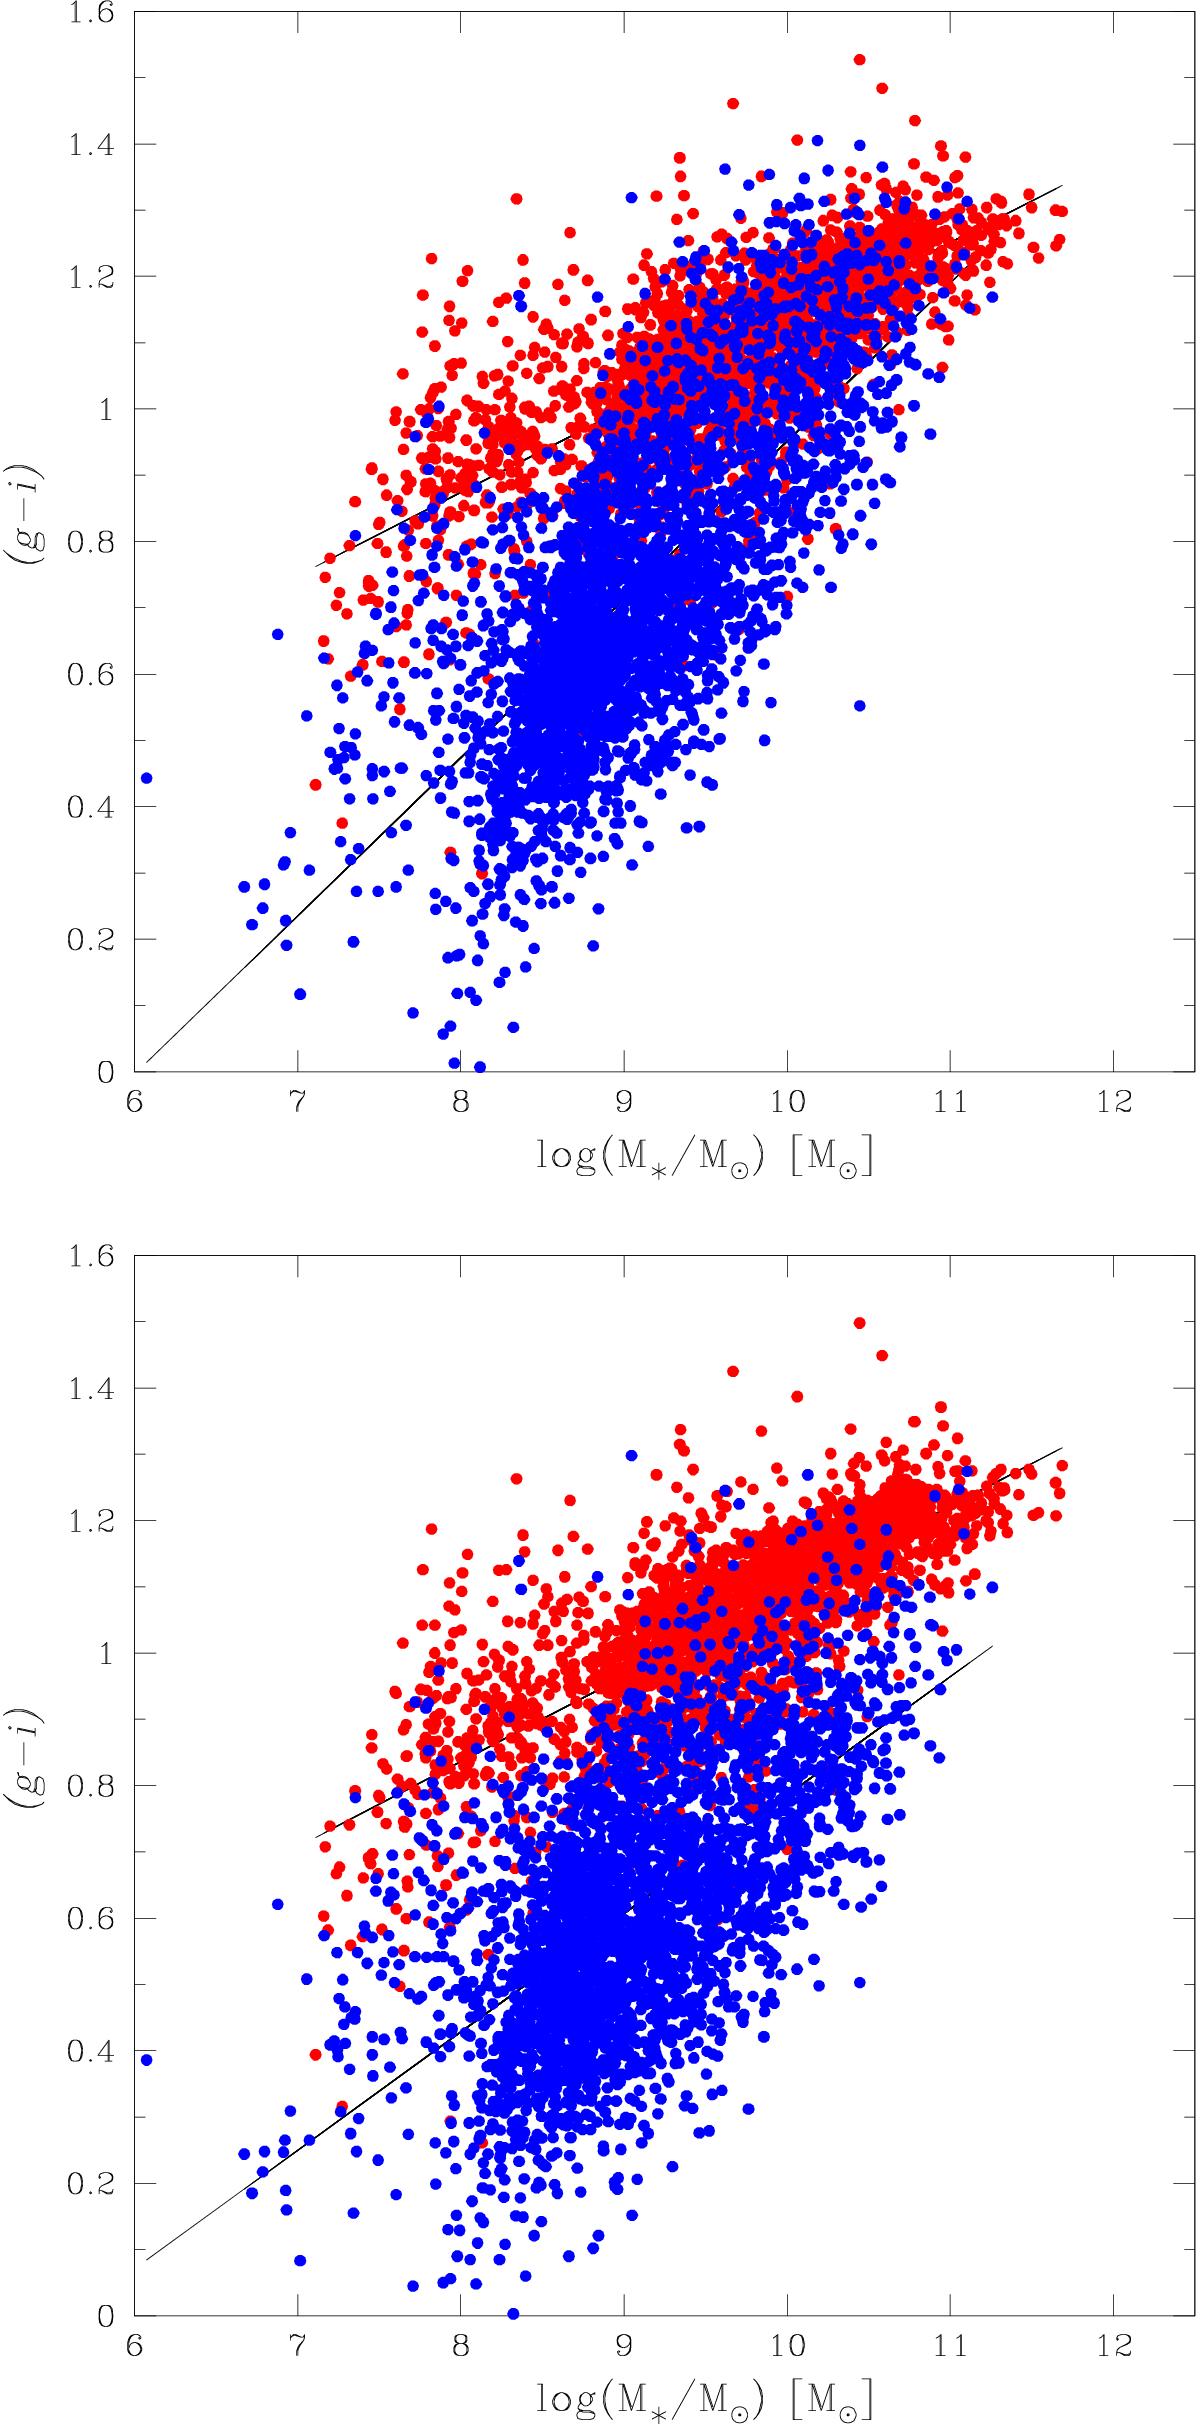
Top: color magnitude diagram of the observed colors displaying the well known bimodal distribution for late type galaxies (blue cloud, blue dots) and early type galaxies (red sequence, red dots). Bottom: the color magnitude diagram after the inclination correction has been applied. The red sequence and the blue cloud are well separated at all masses.
Current usage metrics show cumulative count of Article Views (full-text article views including HTML views, PDF and ePub downloads, according to the available data) and Abstracts Views on Vision4Press platform.
Data correspond to usage on the plateform after 2015. The current usage metrics is available 48-96 hours after online publication and is updated daily on week days.
Initial download of the metrics may take a while.